IDE integration
The earlier you start thinking about the well-formedness and security of your APIs, the less you need to backtrack to fix issues later on. Follow best practices already when developing your API definitions makes getting it right less of a chore.
You can install the extension OpenAPI (Swagger) Editor to integrate 42Crunch Platform features to with your IDE (integrated development environment). API Security Audit and API Scan enable you to start checking the quality of your API definition already when you are working on it, while API Contract Generator speeds up the creation of an API definition itself.
Despite the name, you can use OpenAPI (Swagger) Editor for both OpenAPI and GraphQL APIs. GraphQL federation is not supported in IDEs.
You can also integrate Security Audit with your CI/CD pipeline so that any changes to APIs in your project are automatically audited for security. For more details, see CI/CD integration.
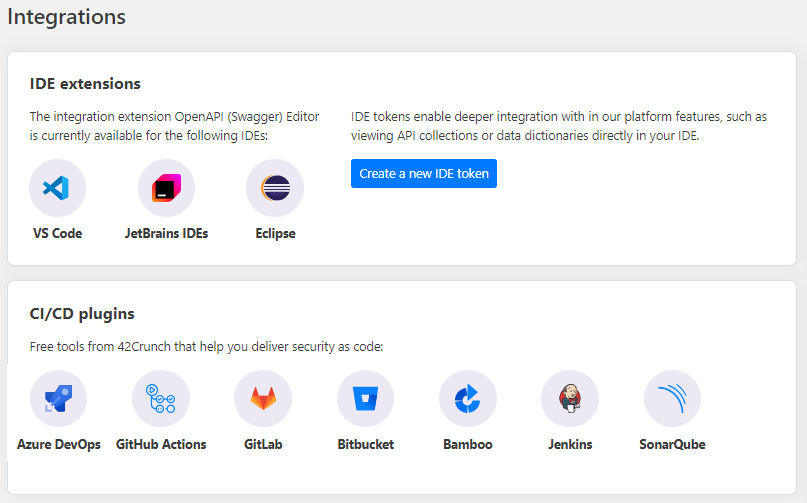
Supported IDEs
The integration extension OpenAPI (Swagger) Editor is currently available for the following IDEs:
- Microsoft Visual Studio Code (VS Code)
- JetBrains IDEs:
- Android Studio
- AppCode
- Aqua
- CLion
- Code With Me Guest
- DataSpell
- DataGrip
- JetBrains Gateway
- GoLand
- IntelliJ IDEA (both Ultimate and Community)
- JetBrains Client
- MPS
- PhpStorm
- PyCharm (both Professional and Community)
- Rider
- RubyMine
- RustRover
- WebStorm
- Writersid
- Eclipse IDE (including Mulesoft's Anypoint Studio)
You can find links to more details for all supported options from the 42Crunch Platform landing page.
How IDE integration works
To integrate your IDE with 42Crunch Platform, you must first install the extension OpenAPI (Swagger) Editor to your IDE. After that, you can choose either the free but limited experience, or the full experience for paying customers.
- Paying customers use IDE tokens to configure the IDE extension to access and authenticate to 42Crunch Platform. You can create IDE tokens in 42Crunch Platform, either on the landing page or in your platform account settings. This documentation describes usage for paying customers.
- Free customers can use freemium tokens in their IDEs to configure using the more limited freemium service locally. For more details on the freemium service, see Freemium User FAQ.
Security Audit in IDEs
Security Audit lets you check the quality and security of your API definition already when working on it. Just like in 42Crunch Platform, you get an audit score that tells you how well-defined your API definition is, and the audit report provides you more details on the found issues as well as suggestions on how to remediate them.
If your organization has specified some tag categories to be mandatory for all APIs, you can add those tags in the extension settings, and if your then import the API to 42Crunch Platform through the IDE, those tags are persisted.
API Scan in IDE supports both OpenAPI definitions and GraphQL schema definition files. GraphQL introspection files or GraphQL federation are not supported.
Audit runtime options
The IDE extension provides two runtime options for how to run Security Audit and get results in your IDE:
- Platform: Connect to 42Crunch Platform to run Security Audit. The IDE extension creates a temporary API collection for your API which is deleted after the audit is finished, so your API is not yet imported to the platform. Running audit on the platform also shows if your API passes or fails the default security quality gate (SQG) of your organization.
- 42Crunch API Security Testing (AST) binary: Automatically download the AST binary and run the audit locally on your machine. Before running the audit, the AST binary connects to the platform to verify your IDE token. However, the audit process itself is run locally and therefore does not provide the SQG information.
You can run audit either on the whole API or on individual API operations. However some issues, such as problems in your global security requirements, can only be discovered when auditing the full API.
API Scan in IDEs
API Scan lets you scan the API operation to check that the API implementation has no vulnerabilities and that it behaves correctly, even in response to malformed requests. Just like with Security Audit, you get a scan report directly in your IDE, with more details on the issues that the scan uncovered.
API Scan in IDE supports both OpenAPI definitions and GraphQL schema definition files. GraphQL introspection files or GraphQL federation are not supported.
The scan generates real traffic to the selected API endpoint and could incur costs depending on your setup.
For best results, make sure that your API definition is valid and well-formatted before you scan it. The API must be deployed so that the API endpoint is live, and the backend server your API uses must be accessible to API Scan. Otherwise the API cannot be scanned.
API Scan can have potential side effects: APIs can throw exceptions, fail, and data can be affected. As per our terms and conditions, you must only run invasive scans, such as conformance scan and fuzzing requests, against APIs that you own, and only against non-production systems and non-production data! Do not run other scan types except the non-invasive drift scan in production environment!
The IDE extension also offers the Try It feature that you can use to simply test how the operation you are developing currently works by sending a single HTTP request and modifying, for example, the parameters, request body, or authentication settings used. This way you can test that the implementation is going to the direction you want it to.
You can also use the IDE to hone your scan configuration and test the impact of your changes on the happy path request. This helps get the happy paths right even before you start the actual scan. API Scan in IDEs does not currently take scan configurations from 42Crunch Platform, instead it generates a default scan configuration and stores it in your local file system. You can view this configuration in your IDE and edit it as necessary, all the while checking in practice how your changes affect the scan. Once satisfied with your scan configuration, if you have the API in question already in 42Crunch Platform, you can just upload the scan configuration for it and use it when running Scan v2 on that API.
When running scan in IDE, you cannot scan APIs through 42Crunch Platform. Only Scan v2 is supported. Drift scan is not supported in IDE.
Scan runtime options
The IDE extension provides three runtime options for how to run API Scan and get results in your IDE:
- AST binary: Automatically download the AST binary and run the scan locally on your machine. Before running the scan, the AST binary connects to the platform to verify your IDE token.
- API Scan on premises: Use the standard API Scan v2 Docker images to run the scan in Docker on your machine (see Running API Scan on premises).
- API Scan Jobs Manager: Add Scan Jobs Manager into your Kubernetes cluster to run API Scan Docker images remotely as a Kubernetes job (see the scand-manager repository).
Scanning individual API operations gives focused results quickly on the API operation you are currently working on and avoids unnecessary noise during the development time. You can scan the full API in your IDE when you are ready with your development work to see if there are other issues to fix.
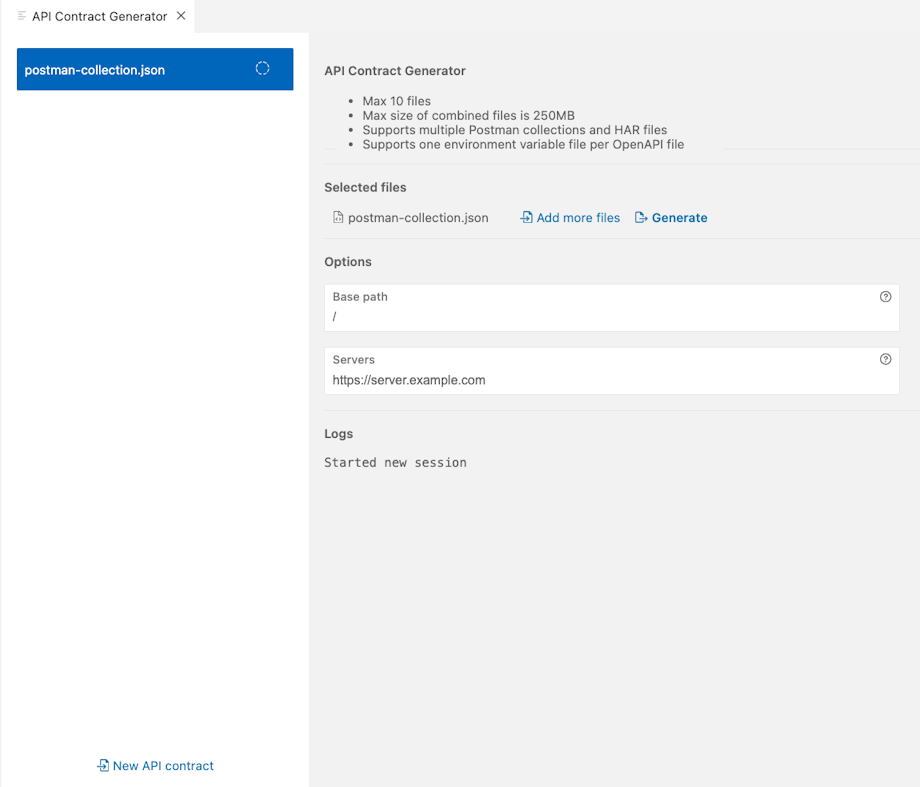
API Contract Generator in IDEs
API Contract Generator avoids having to start from scratch and manually defining a whole OpenAPI definition. If you have an existing API implementation but no OpenAPI definition for it, you can use API Contract Generator to automatically generate one for it. This speeds up the process of catching up with documenting your existing APIs which can be challenging, especially for code-first companies.
Upload up to 10 files as input and API Contract Generator generates an OpenAPI definition for your API. These files can be either Postman collections as JSON files, HAR files generated with the browser developer tools, or a mix of the two. Each set of files that you select is used to generate a single OpenAPI contract. The maximum combined file size of the input files is 250 MB. Currently, GraphQL APIs are not supported.
If you are using environment variables in your Postman collections, you can export them from Postman and include in the resulting environment variable file as input for API Contract Generator. Only one environment variable file can be used for each generated API. For more details about environment variables in Postman and how to export them, see the Postman documentation.
Because API Contract Generator is available directly in your IDE, once you have your new OpenAPI definition you can seamlessly jump to work on and edit the API definition further, taking advantage of the full capabilities of your IDE, auditing and scanning the API definition as you go along.
VS Code integration
The OpenAPI (Swagger) Editor for VS Code makes creating and navigating API definitions quicker and easier, and integrates Security Audit and API Scan with VS Code.
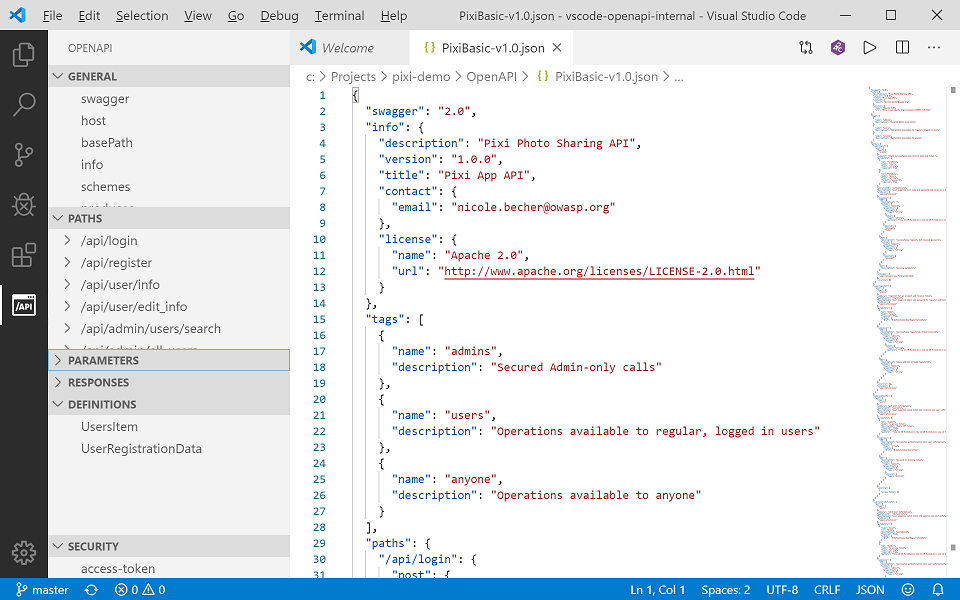
With the IDE extension, you can run Security Audit straight from the VS Code window: just click the button at the top edge. You need a token to authenticate to Security Audit. You can use the OpenAPI (Swagger) Editor extension to audit both OpenAPI definitions and GraphQL definitions.
You can also find a tutorial video on OpenAPI (Swagger) Editor in VS Code here.
Audit report in VS Code
Like in 42Crunch Platform, running Security Audit from VS Code gives an audit score for the API definition and produces a report on the found issues. However, navigating a report is bit different from the platform UI.
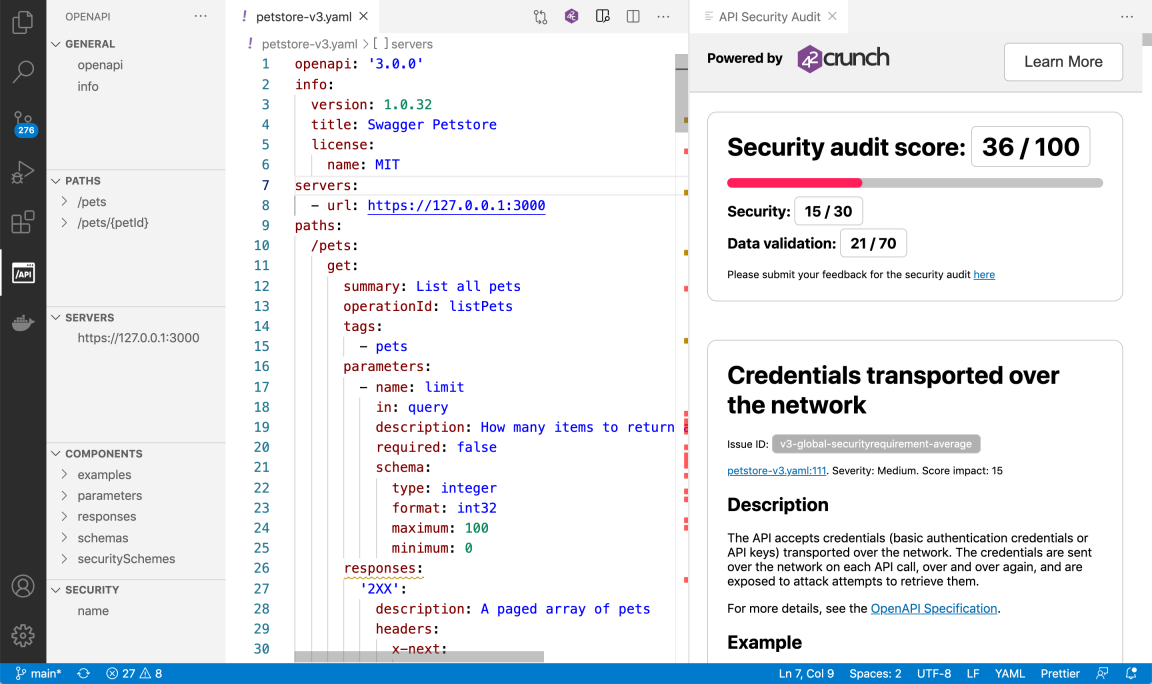
The scoring, issue IDs, and the descriptions and remediations for all found issues are shown on the right. The status bar at the bottom left shows a quick overview on the severity levels of the found issues:
- : critical or high
- : medium
- : low
You can click on the icons to open the problems view that shows the titles of critical, high, and medium issues.
The color blocks in the minimap show where in your API definition the issues occur, so you can easily hop to check the spot in your code. In the code, wavy lines in matching color mark the affected element and hovering on it shows all issues in that spot.
You can also open an audit report exported from 42Crunch Platform and view it in your IDE. See Load audit report from a file.
API Scan in VS Code
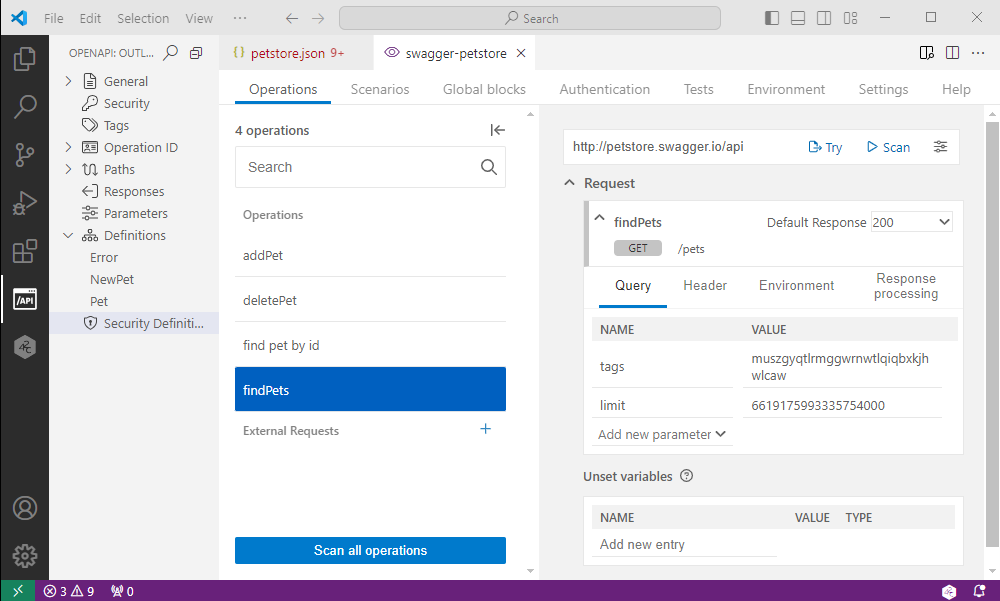
Clicking Scan in VS Code opens the scan configuration, with all operations in your API listed by their operationId. Clicking on an operationId lets you view and edit the scan configuration for a particular operation. You can, for example:
- Create and edit scenarios, global preprocessing and postprocessing block, or custom tests. For more details, see Scan scenarios.
- Populate environment variables used in your scan configuration with data from external sources, such as secrets.
- Change the scan runtime settings.
Not all scan settings might be available in the IDE.
You can find more information on API Scan directly in your IDE on the Help tab.
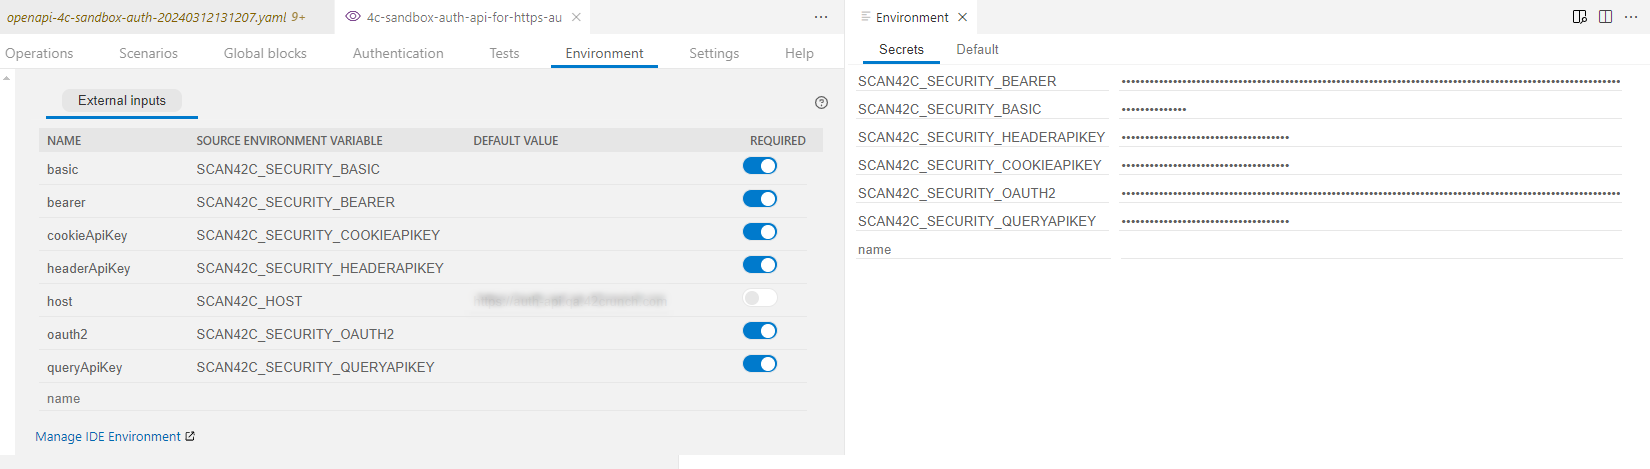
If your API uses authentication, by default the scan in the IDE expects all security requirements to be required in any scan you perform and the scan fails unless you specify all SCAN42C_SECURITY_ environment variables for them. However, if you only want to scan a single operation and do not want to specify other security requirements than what the operation in question uses, you can mark the other security requirements as not required, and switch them back to required when you are done.
JetBrains integration
The for JetBrains IDEs makes creating and navigating API definitions quicker and easier, and integrates Security Audit and API Scan with your IDE.
With the IDE extension, you can run Security Audit straight from the IDE: just click the button at the top edge. You need a token to authenticate to Security Audit. You can use the OpenAPI (Swagger) Editor extension to audit both OpenAPI definitions and GraphQL definitions.
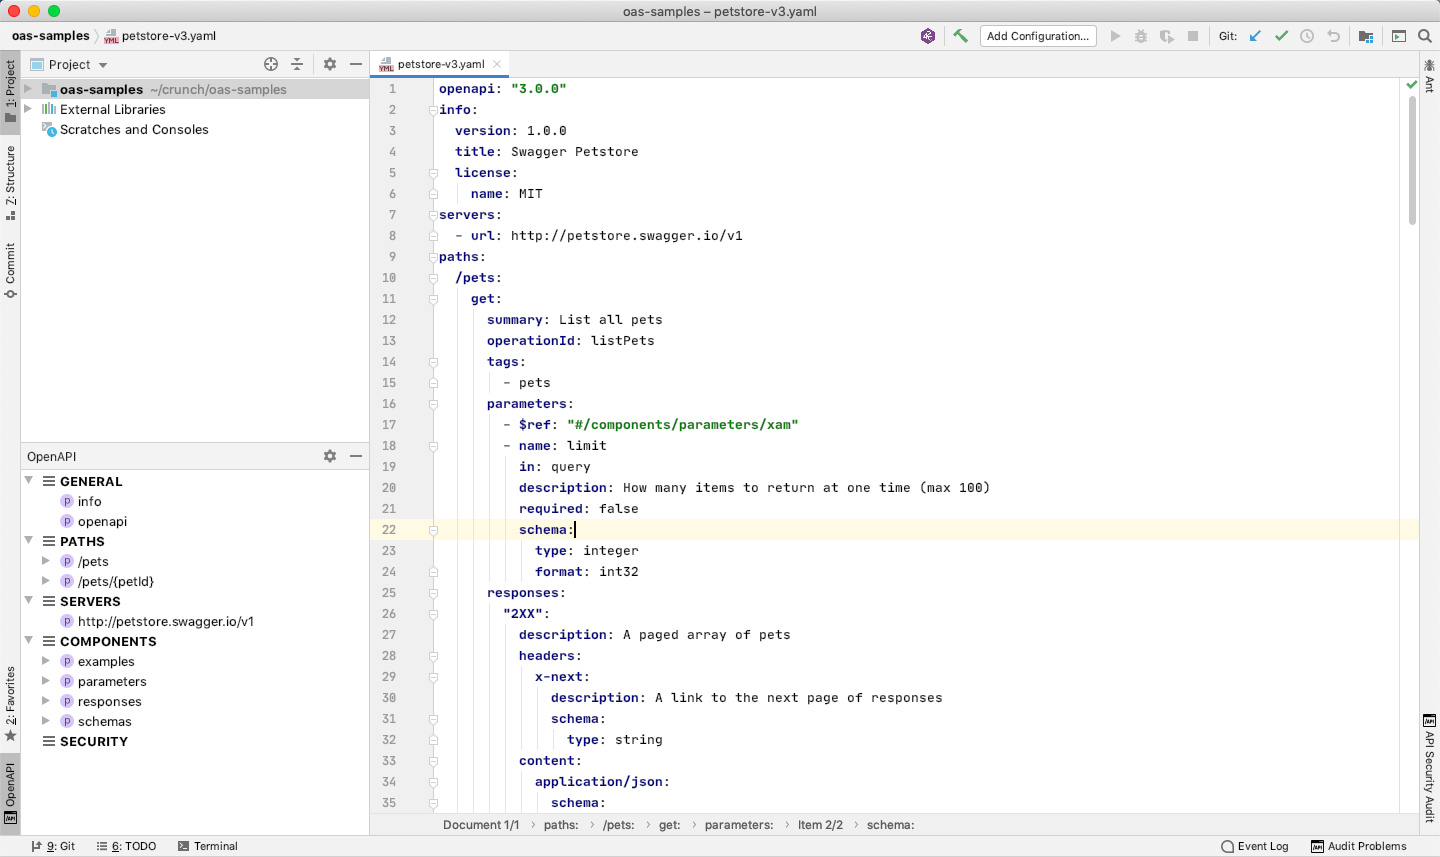
Audit report in JetBrains IDEs
Like in 42Crunch Platform, running Security Audit from your IDE gives an audit score for the API definition and produces a report on the found issues. However, navigating a report is bit different from the platform UI.
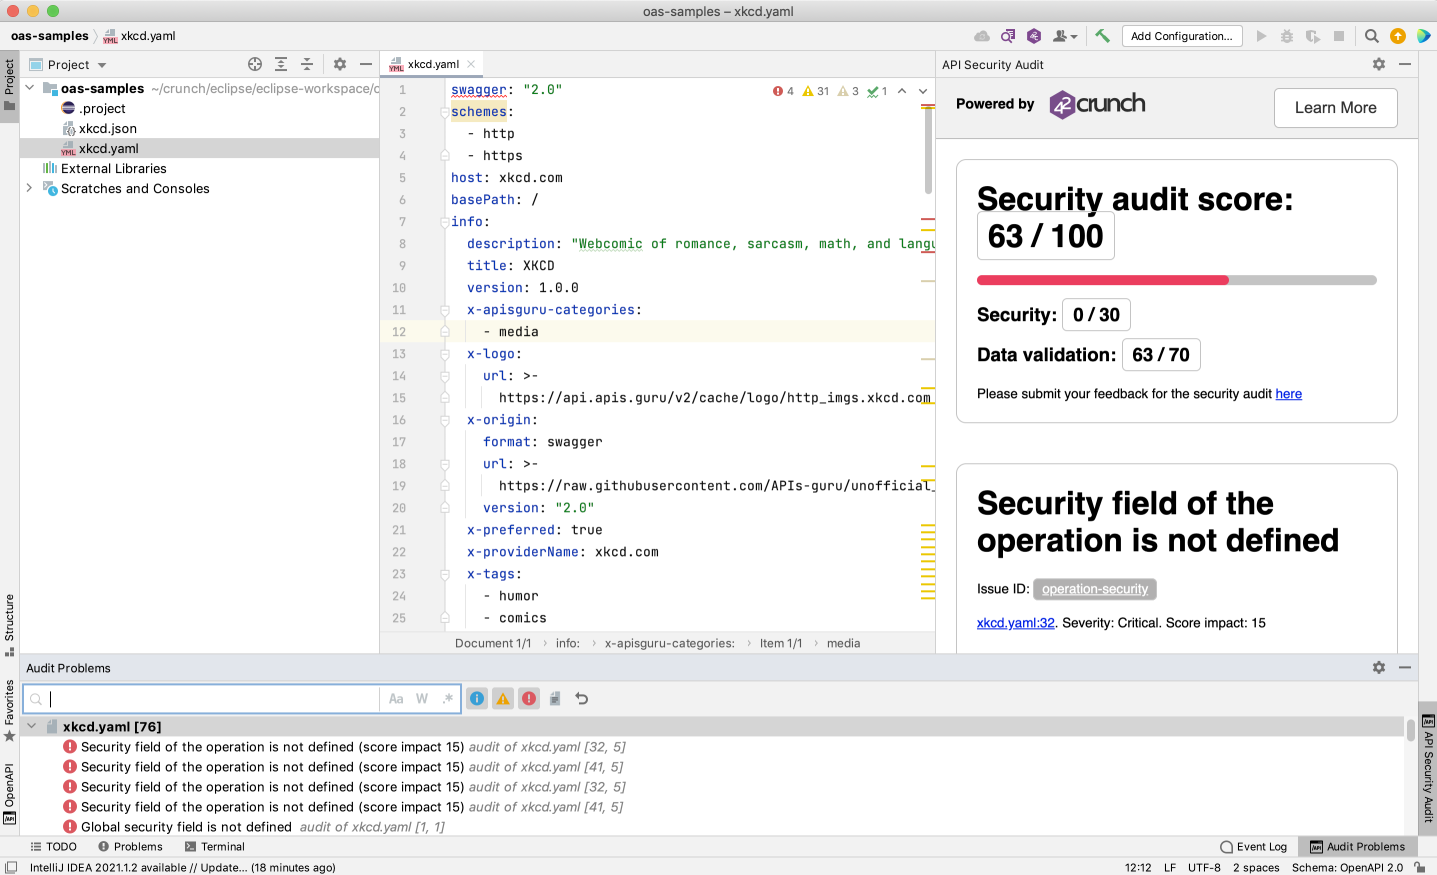
The scoring, issue IDs, and the descriptions and remediations for all found issues are shown on the right.
You can click on the icons to open the problems view that shows the titles of critical, high, and medium issues:
- : critical or high
- : medium
- : low
The color blocks in the minimap show where in your API definition the issues occur, so you can easily hop to check the spot in your code. In the code, wavy lines in matching color mark the affected element and hovering on it shows all issues in that spot.
You can also open an audit report exported from 42Crunch Platform and view it in your IDE. See Load audit report from a file.
API Scan in JetBrains IDEs
Clicking Scan in your IDE opens the scan configuration, with all operations in your API listed by their operationId. Clicking on an operationId lets you view and edit the scan configuration for a particular operation. You can, for example:
- Create and edit scenarios, global preprocessing and postprocessing block, or custom tests. For more details, see Scan scenarios.
- Populate environment variables used in your scan configuration with data from external sources, such as secrets.
- Change the scan runtime settings.
Not all scan settings might be available in the IDE.
You can find more information on API Scan directly in your IDE on the Help tab.
If your API uses authentication, by default the scan in the IDE expects all security requirements to be required in any scan you perform and the scan fails unless you specify all SCAN42C_SECURITY_ environment variables for them. However, if you only want to scan a single operation and do not want to specify other security requirements than what the operation in question uses, you can mark the other security requirements as not required, and switch them back to required when you are done.
Eclipse integration
The OpenAPI (Swagger) Editor for Eclipse IDE makes creating and navigating API definitions quicker and easier, and integrates Security Audit and API Scan with Eclipse.
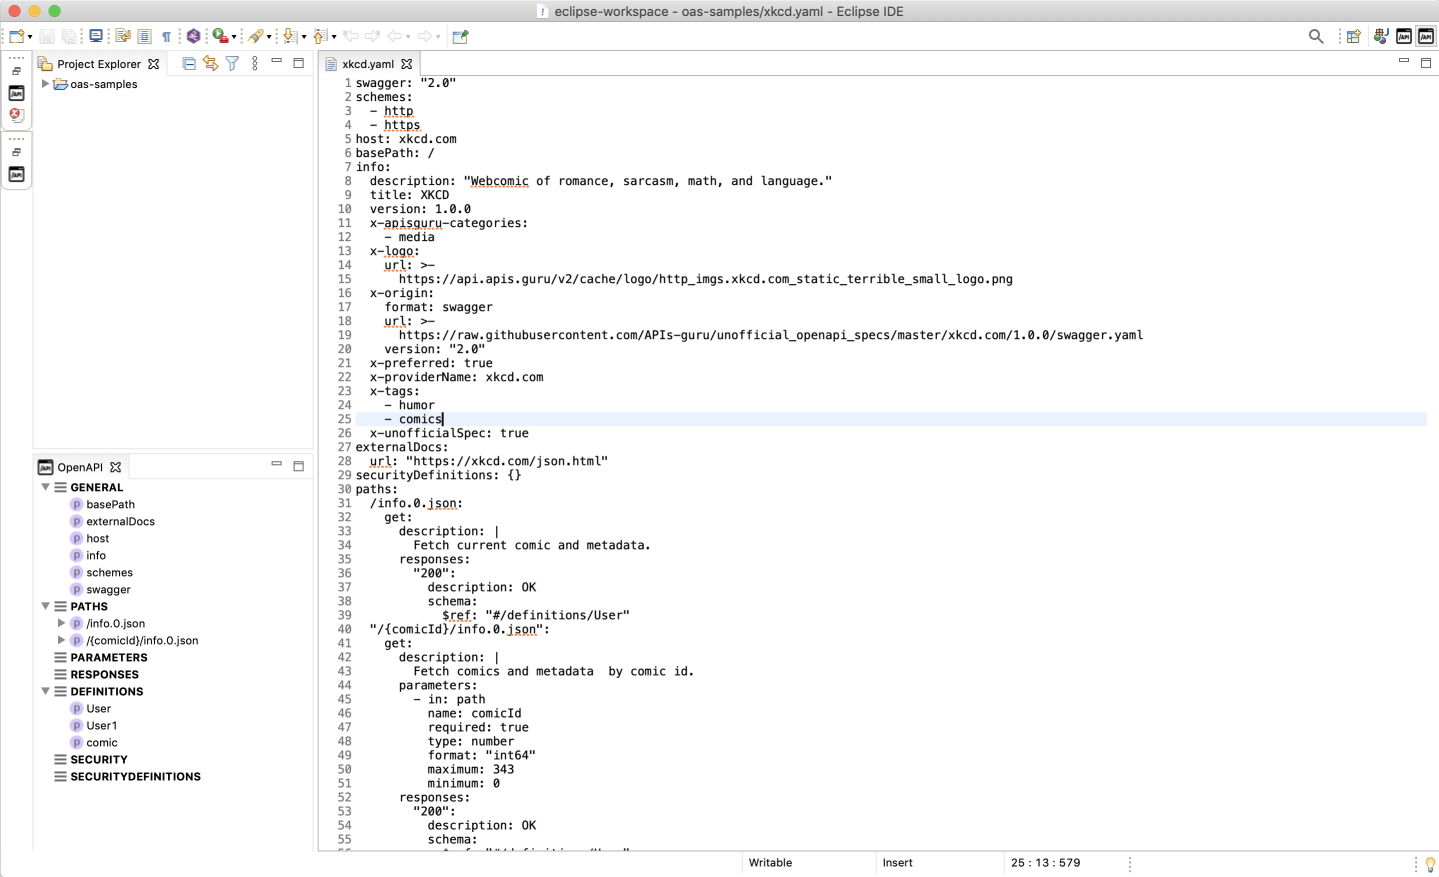
With the IDE extension, you can run Security Audit straight from the Eclipse window: just click the button at the top edge of the workbench. You need a token to authenticate to Security Audit. You can use the OpenAPI (Swagger) Editor extension to audit both OpenAPI definitions and GraphQL definitions.
Audit report in Eclipse
Like in 42Crunch Platform, running Security Audit from Eclipse gives an audit score for the API definition and produces a report on the found issues. However, navigating a report is bit different from the platform UI.
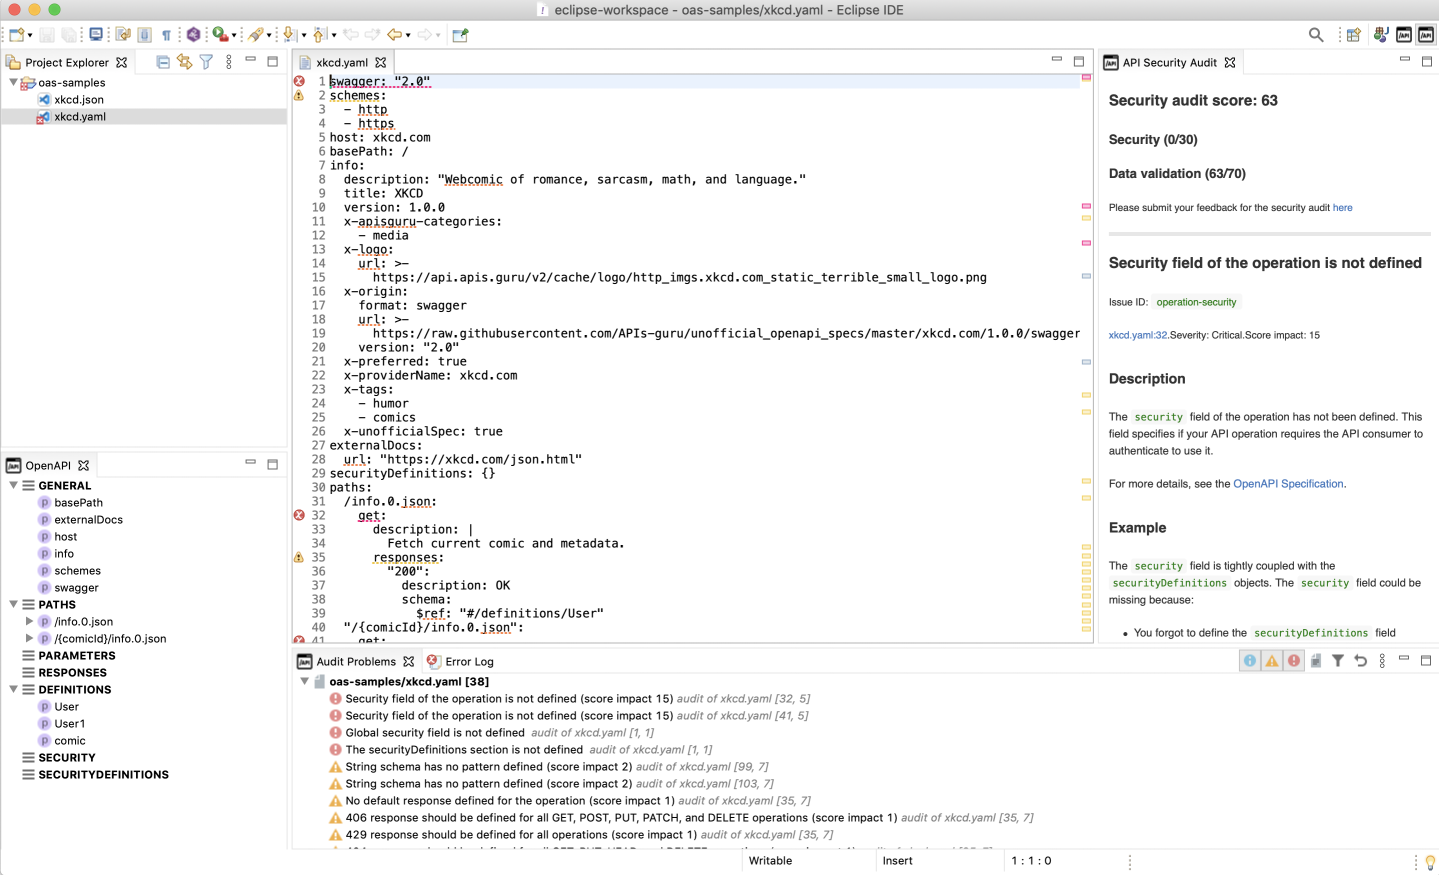
The scoring, issue IDs, and the descriptions and remediations for all found issues are shown on the right.
You can click on the icons to open the problems view that shows the titles of critical, high, and medium issues:
- : critical or high
- : medium
- : low
The color blocks in the minimap in the editor show where in your API definition the issues occur, so you can easily hop to check the spot in your code. In the code, dashed lines in matching color mark the affected element and hovering on it shows all issues in that spot.
You can also open an audit report exported from 42Crunch Platform and view it in your IDE. See Load audit report from a file.
API Scan in Eclipse
Clicking Scan in Eclipse opens the scan configuration, with all operations in your API listed by their operationId. Clicking on an operationId lets you view and edit the scan configuration for a particular operation. You can, for example:
- Create and edit scenarios, global preprocessing and postprocessing block, or custom tests. For more details, see Scan scenarios.
- Populate environment variables used in your scan configuration with data from external sources, such as secrets.
- Change the scan runtime settings.
Not all scan settings might be available in the IDE.
You can find more information on API Scan directly in your IDE on the Help tab.
If your API uses authentication, by default the scan in the IDE expects all security requirements to be required in any scan you perform and the scan fails unless you specify all SCAN42C_SECURITY_ environment variables for them. However, if you only want to scan a single operation and do not want to specify other security requirements than what the operation in question uses, you can mark the other security requirements as not required, and switch them back to required when you are done.