API monitoring
With APIs, your business is real-time and needs accurate and timely information in all aspects of its operations. 42Crunch API Security Platform provides monitoring for your APIs and the API Firewall instances, so that you always have up-to-date information on the quality, security, and stability of your API infrastructure. The available metrics depend on the type of your API (OpenAPI or GraphQL).
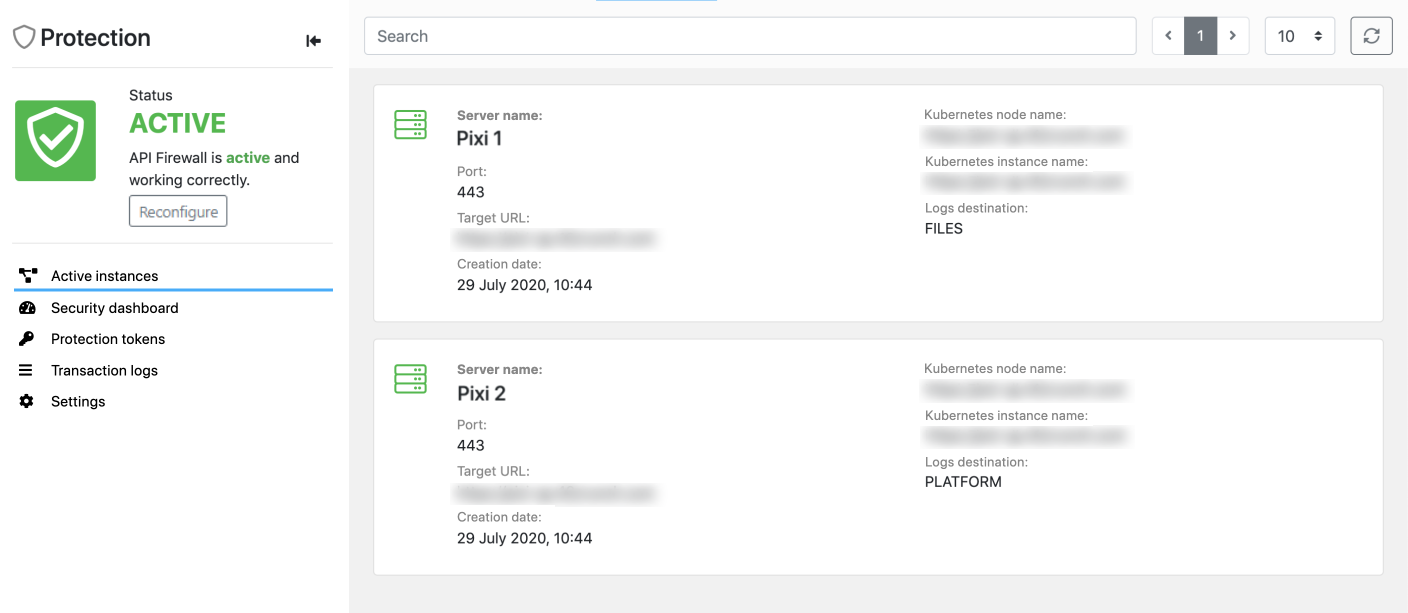
Each API lists the running API Firewall instances that are protecting the API in different deployments. Each API Firewall instance is powered by an engine called Guardian. As part of its operation, Guardian writes logs on the firewall operation and API transactions, and relays this information back to 42Crunch Platform. This way, you can view all the logs for your API in one place. 42Crunch Platform also provides Trace Explorer where you can check the details of individual transactions from the API traffic.
System logs on access and errors from the API Firewall instance itself are located under /opt/guardian/logs in the file system of the API Firewall container.
For more details on different logs that API Firewall produces, see API Firewall logs.
Dashboards
There are two types of dashboards 42Crunch Platform that all users can use to monitor their APIs:
- Collection dashboard: This dashboard is mainly fed by data from API Security Audit and API Scan, and it focuses on the quality and security of your API definitions in that particular API collection.
- Security dashboard: This API-specific dashboard is fed by data from API Firewall transaction logs, and it focuses on the API traffic to the protected APIs. To have data, you must first deploy an API Firewall instance to protect your API.
In addition, organization administrators also have executive dashboard that provides statistics on all APIs in their organization in 42Crunch Platform. This dashboard also shows APIs' compliance to security quality gates (SQGs) that they must pass.
Collection dashboards
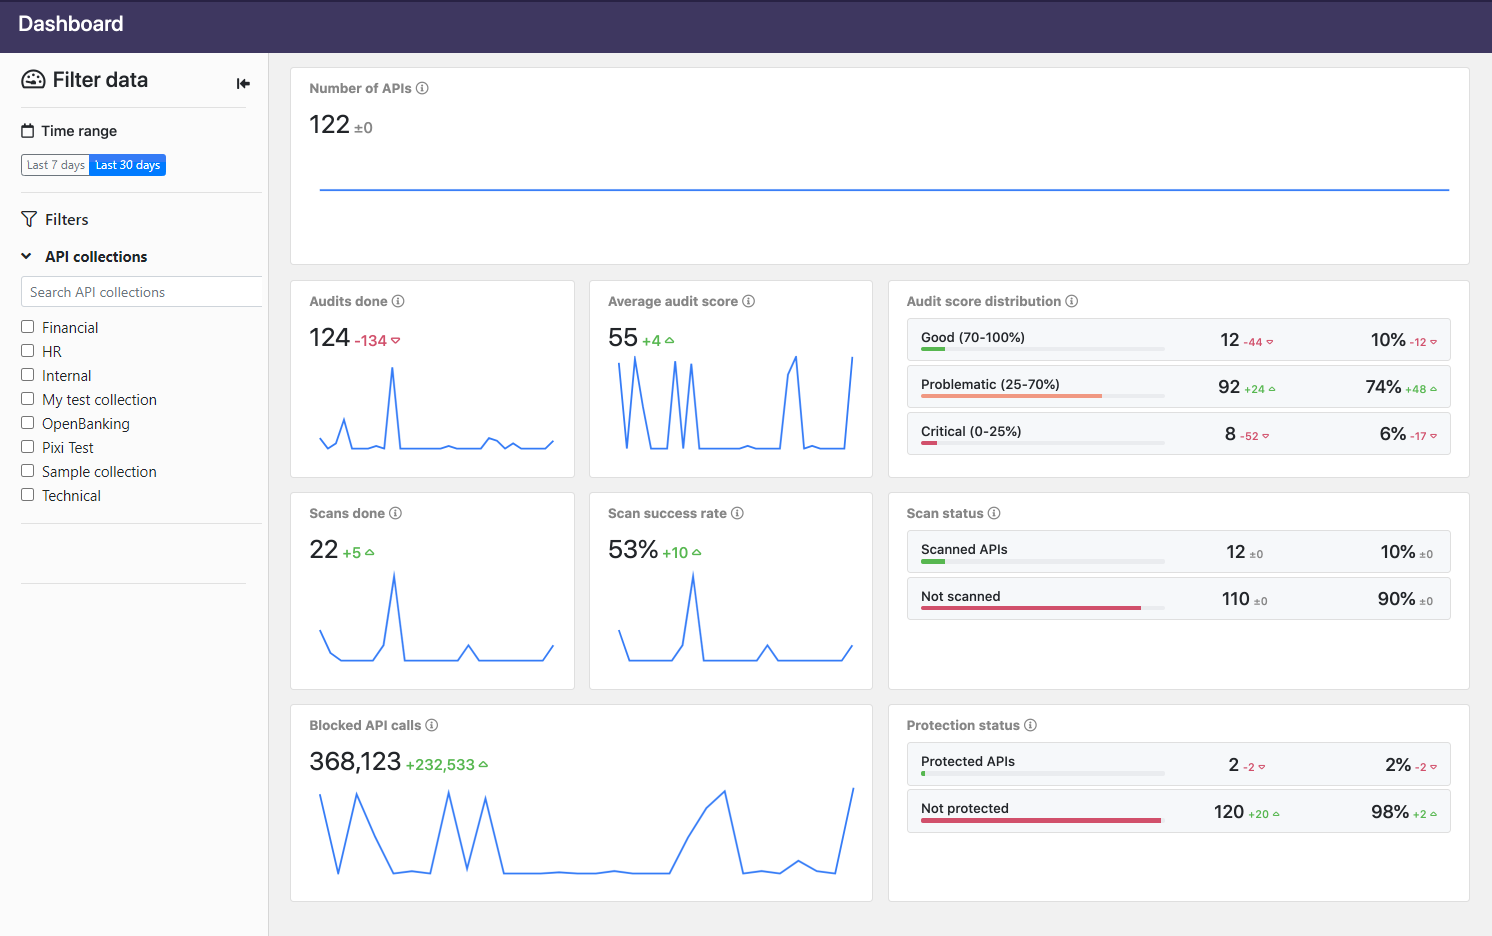
Collection dashboards show the statistics for the APIs in a particular API collection. All users can view the collection dashboards in API collections available for them. The statistics are for whole collections, not individual APIs.
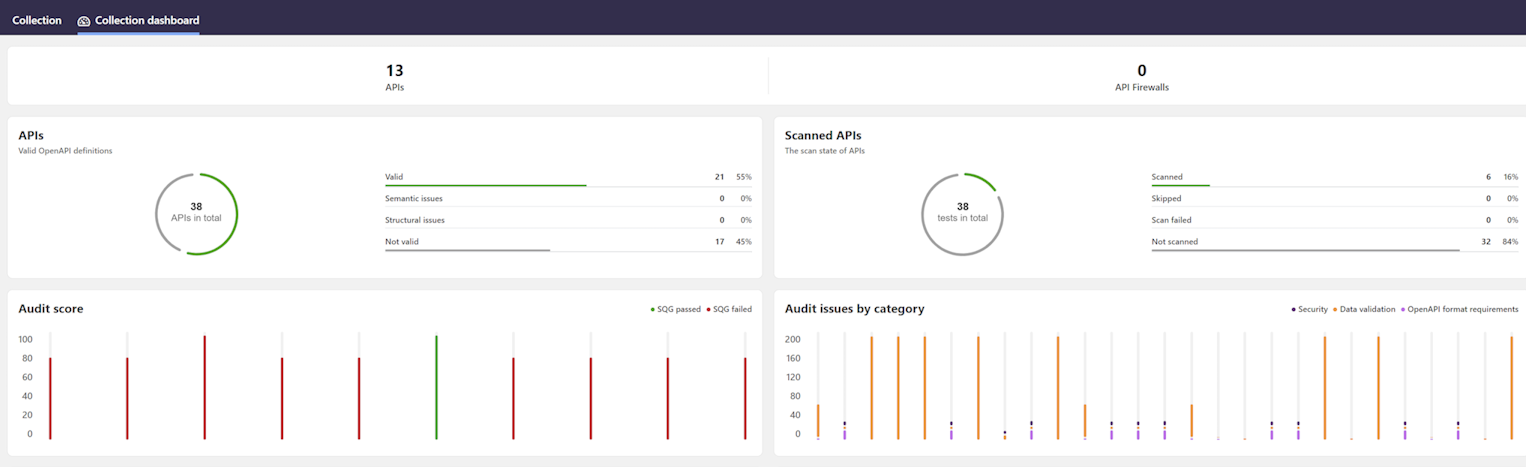
The dashboard shows how many of your APIs have valid API definitions conforming to the standard they claim to follow, and how many of them have been scanned for discrepancies in the implementation. The charts for Security Audit and API Scan show how your API collections are in general in terms of quality. You can also change what statistics are shown, like the number of issues, or the proportion of the severity levels or categories. In addition, you can see how many API Firewall instances are in that collection.
Security dashboards
Security dashboards summarize the API Firewall logs in an at-a-glance view of main trends in the protection of a particular API. Security dashboards collate the information from all active API Firewall instances to graphical dashboards that provide an overview on the traffic to and from the API. All users can view the security dashboards of the APIs available for them.
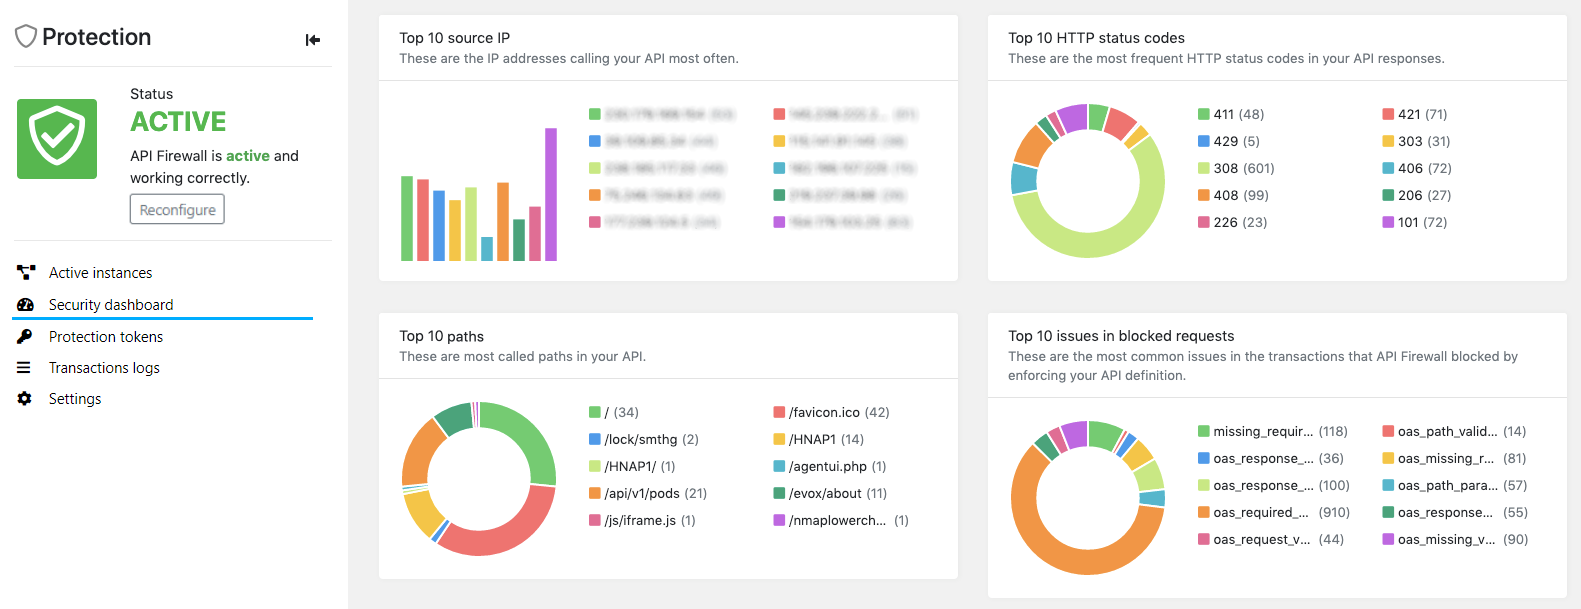
A security dashboard can tell you, for example:
- Which IP addresses are calling your API most frequently?
- What paths in your API get called most often?
- What HTTP status codes is your API responding to API consumers most frequently?
- What are the most common errors in transactions (both requests and responses) that do not conform to the contract set in the API definition of your API?
This information can help you detect:
- Anomalies in API traffic, like bots
- Vulnerable parts in your API which require extra security
- Potential attack vectors
Security dashboards show data on both successful and blocked API transactions, so you can compare their proportions.
Executive dashboard
The executive dashboard provides organization administrators a higher level overview on the quality and security of all APIs in their organization. The dashboard offers two views: executive summary and trends.
Currently, GraphQL APIs are not supported.
The executive summary focuses on the quality of the APIs. You can see at a glance, for example:
- Are APIs passing the quality criteria defined in your SQGs?
- How good is the overall quality of the OpenAPI definitions?
- How severe security issues have been found in the API definitions?
- How many API definitions are valid OpenAPI definitions that conform to the structural and semantic requirements of the OAS?
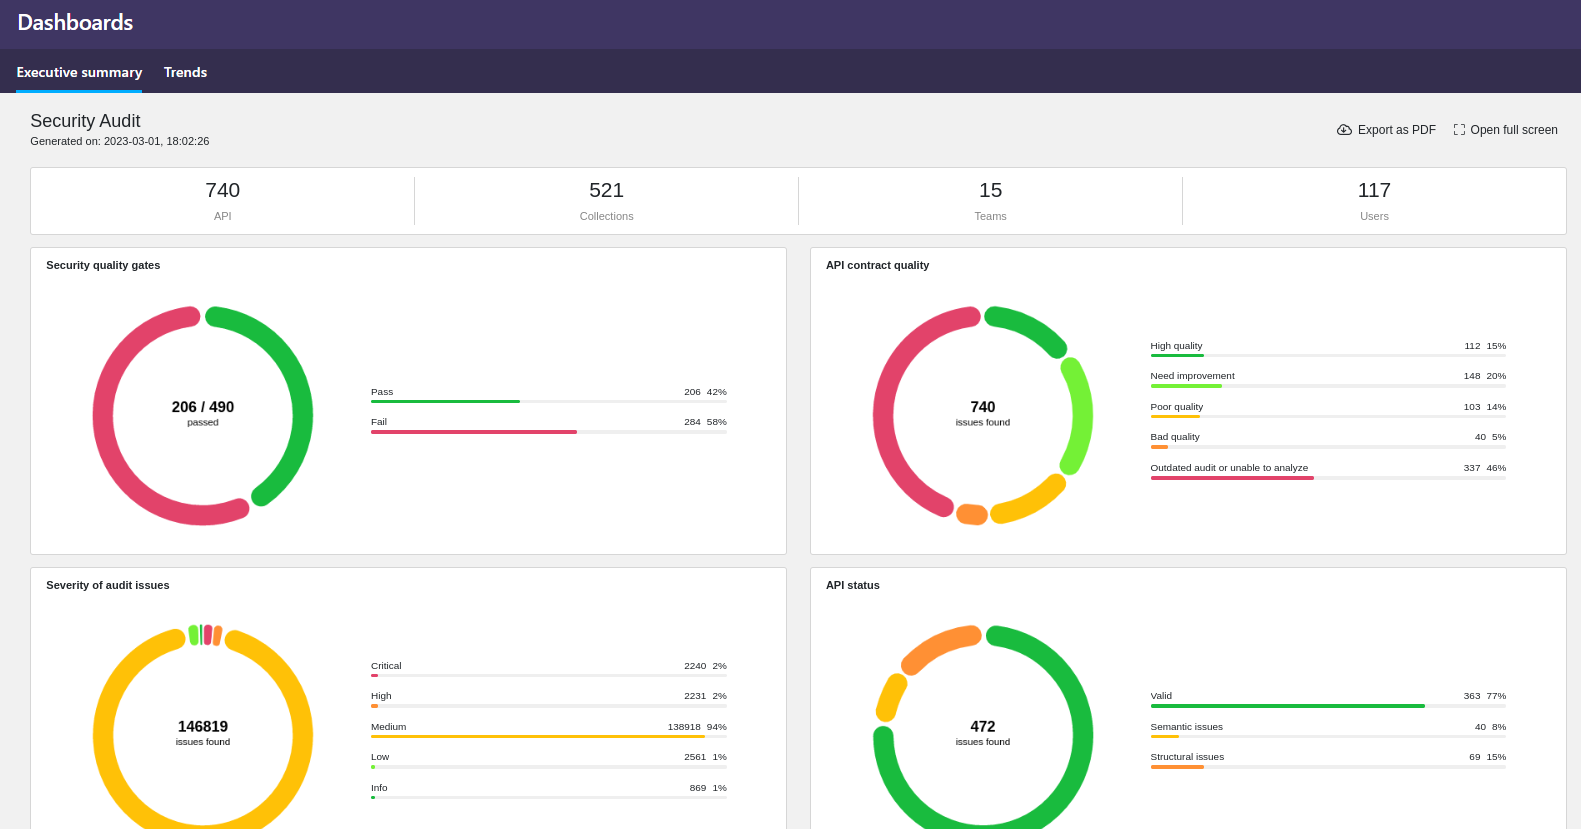
Currently the executive summary is only available on data from Security Audit.
The trends view provides statistics on APIs and API collections in your organization and the ongoing trends in Security Audit, API Scan, and API Protection.
The dashboard shows, for example:
- How many times the APIs have been audited with Security Audit, or scanned with API Scan.
- Changes in the average audit score the APIs are getting in Security Audit.
- The breakdown of the APIs in terms of the quality of their API definitions: how many are good, how many need some attention, and how many have critical issues in their definitions.
- The percentage of the successfully sent scan request as opposed to when the requests have failed. Scan requests can fail because of mistakes in the scan configuration, if the happy path requests setting the baseline for success fail, or if there are connectivity issues with the scanned API. For more details, see How API Scan works.
- How many of the APIs have a running API Firewall instance protecting them.
- The trend in the API calls (both requests and responses) that API Firewall instances protecting the APIs have blocked. The blocked traffic goes against either the API definitions of the protected APIs, or the additional protections you have added for them (see Protections and security extensions).
If you hover on the charts, you see additional information in tool tips. You can also us the filter pane on the left to select what data is shown.
Trace Explorer
In addition to the dashboards, you can also use Trace Explorer to quickly home in on any API from any collection you have access to, and view the trace of its transactions as logged by API Firewall.
Log destination PLATFORM (alone or with STDOUT) is not suitable for firewall instances running in production environment due to the volume of logs produced. We recommend setting the log destination to FILES or STDOUT (or both) in production or for performance testing.
Using the default size for the container file system is fine for testing, or when you can be sure that the logs volume stays low. However, the volume of logs can rapidly increase, especially in production, so if you want to use PLATFORM or FILES (alone or with STDOUT), you must plan for this growth to avoid running out of disk space in your API Firewall container. Either reserve enough disk space, or mount an external disk as a volume.
If you use only STDOUT, then all logs are pushed out of the container, and container disk space is not a concern.
Depending on the nature of your API, transaction logs could include personally identifiable information that falls under, for example, GDPR regulations. To facilitate the requirements from these regulations, such as the right to forget, it is possible to delete transaction logs from 42Crunch Platform. See Delete transaction logs.
If the API is protected with one or more API Firewall instances, Trace Explorer shows you the transaction logs from all the instances. These logs provide detailed information on each API transaction that the firewall instances protecting the API have blocked.
You can also get to the transaction logs from the Protection tab of the API.
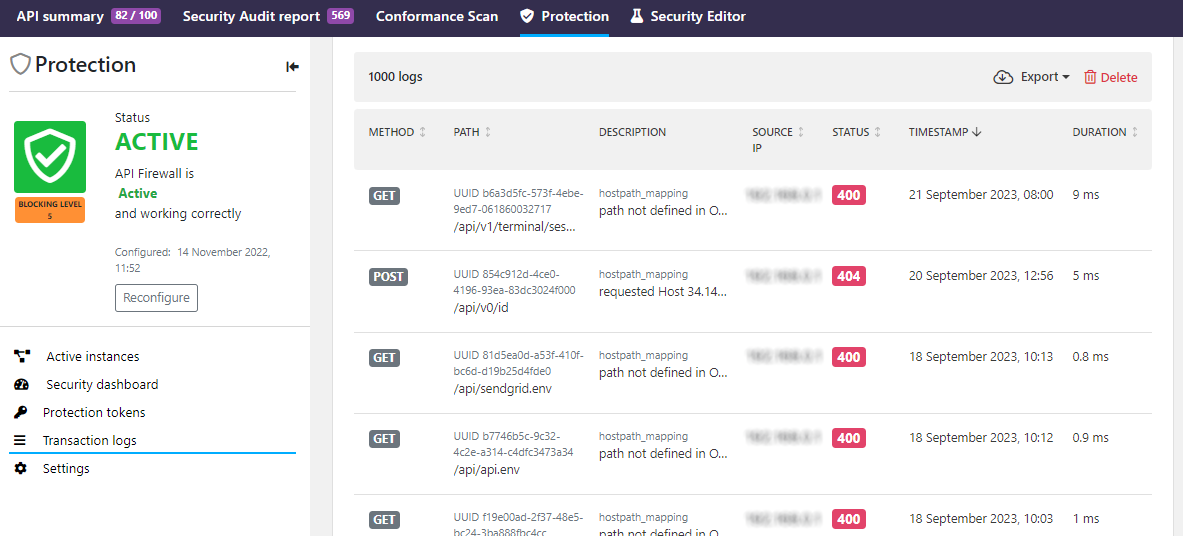
In the transaction logs, you can see the basic information of the blocked transaction, such as:
- The method and path that was called
- Where the call originated
- What was the duration
- Why the call got blocked
For security reasons, when API Firewall blocks a request, the returned response contains just the UUID of the transaction and a minimal description of the issue. This way, the response does not reveal any information on the API, the backend, or implementation details that could be used to craft attacks against them. In 42Crunch Platform, you can then search the transactions logs for the particular UUID to retrieve the detailed trace of the blocked transaction.
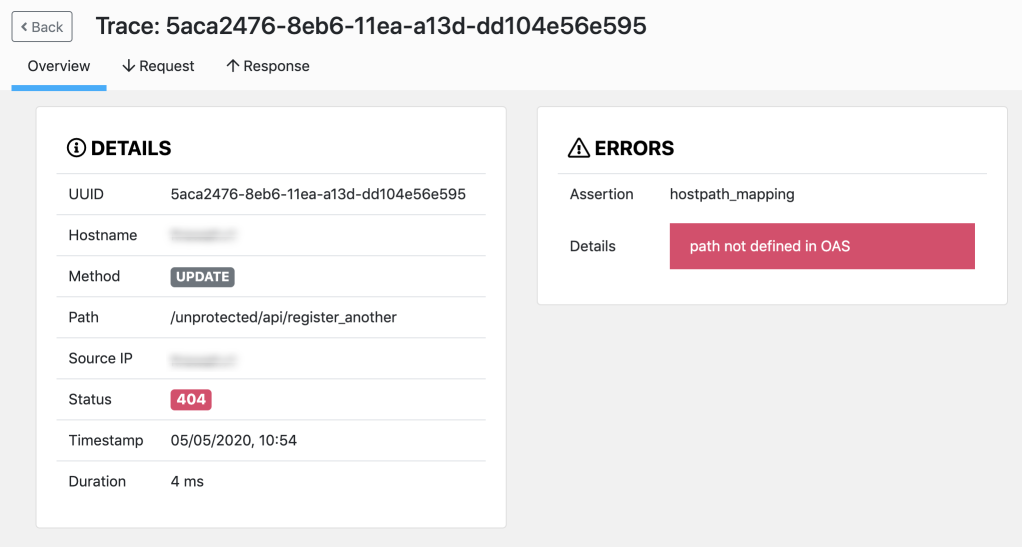
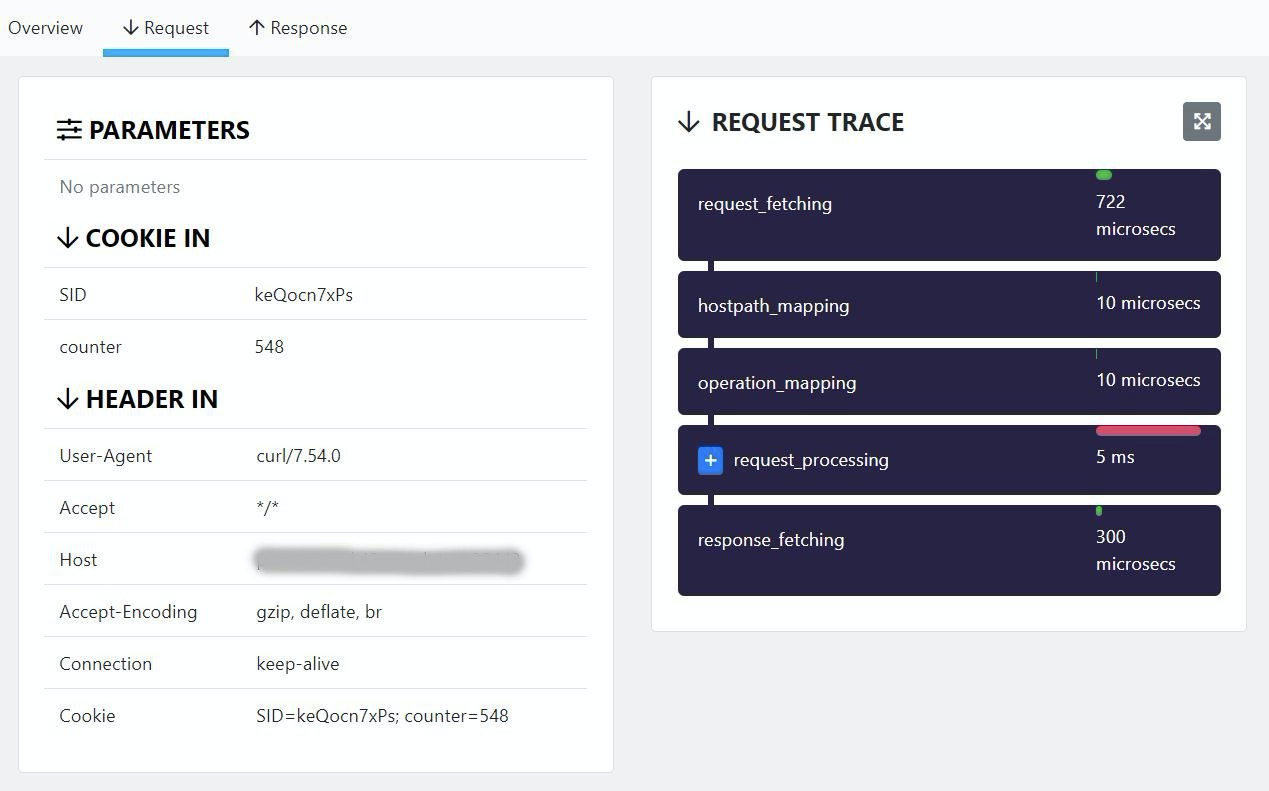
If you click a transaction, you can view a summary of the request, including information on the failure. You can also check the details of the request and response flows: each step the Guardian engine performed is visible and shows information on the performance. You can also view input and output headers as well as parameters. However, transactions payloads are not visible.
If you have the protected API deployed in multiple environments, transaction logs include the logs from all firewall instances. The transaction details show the hostname of the firewall instance that blocked the transaction, so that you know where the transaction took place.
Destinations for logs
By default, API Firewall publishes logs to 42Crunch Platform, so that you can monitor the real-time traffic in the dashboards and Trace Explorer. However, you can also switch the logs destination for an API Firewall deployment to a directory you mount to it. For more details, see Switch log destination for API Firewall logs.
After you switch the destination for logs away from 42Crunch Platform and redeploy the API Firewall instance, all new logs go to the new destination.
If your deployment originally reported logs to 42Crunch Platform, those logs remain in the platform and the data is still reflected in the dashboards. However, because you are now storing the files local to the firewall instance, data in the 42Crunch Platform is no longer updated and the real-time monitoring in the platform is not possible.
You can check from the details of active API Firewall instances where they are storing the logs: