Monitor APIs and API Firewall instances
There are two types of dashboards 42Crunch Platform that all users can use to monitor their APIs:
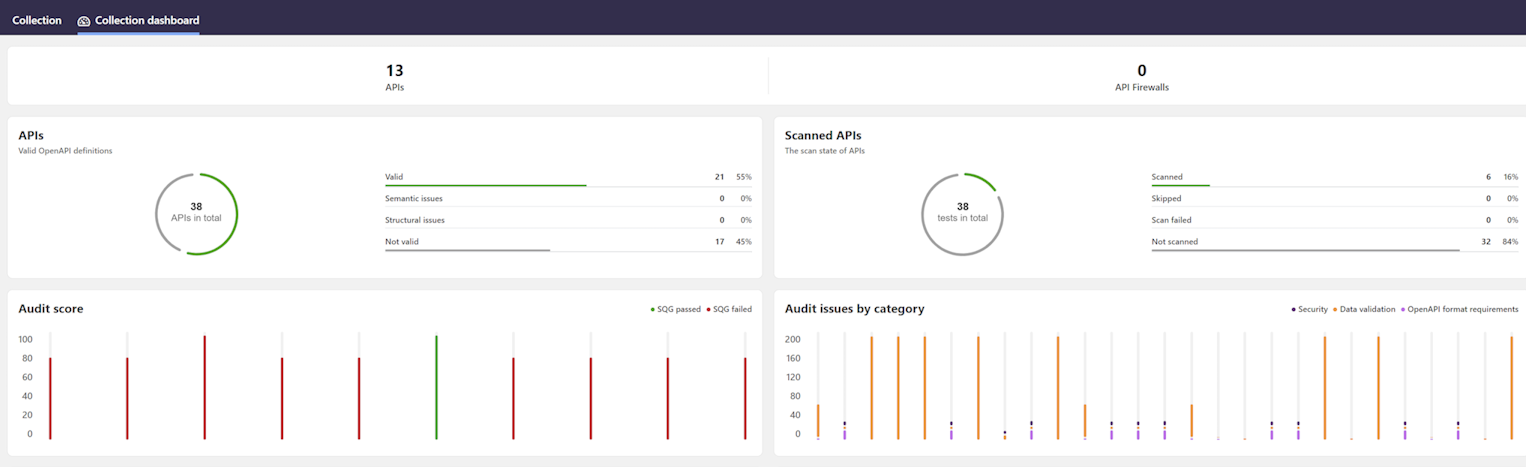
- Collection dashboard: This dashboard is mainly fed by data from API Security Audit and API Scan, and it focuses on the quality and security of your API definitions in that particular API collection.
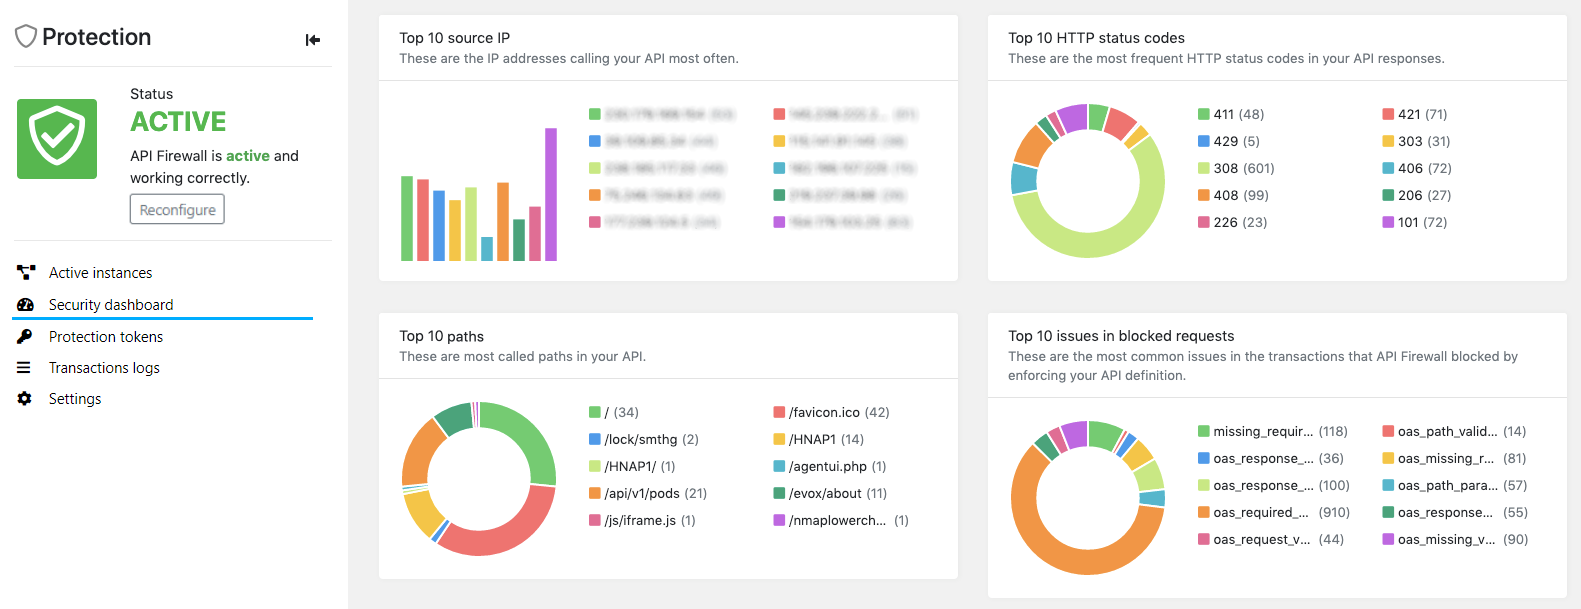
- Security dashboard: This API-specific dashboard is fed by data from API Firewall transaction logs, and it focuses on the API traffic to the protected APIs. To have data, you must first deploy an API Firewall instance to protect your API.
In addition, organization administrators also have executive dashboard that provides statistics on all APIs in their organization in 42Crunch Platform. This dashboard also shows APIs' compliance to security quality gates (SQGs) that they must pass.
Organization administrators have access to view and modify, including sharing, all API collections in their organization. This means that all API collections in an organization are visible to all organization administrators like the collections were their own, both on the API collections page and in the monitoring dashboards. If an organization has several API collections, we recommend using more descriptive collection names that just organization and company name to be able to tell all collections apart.
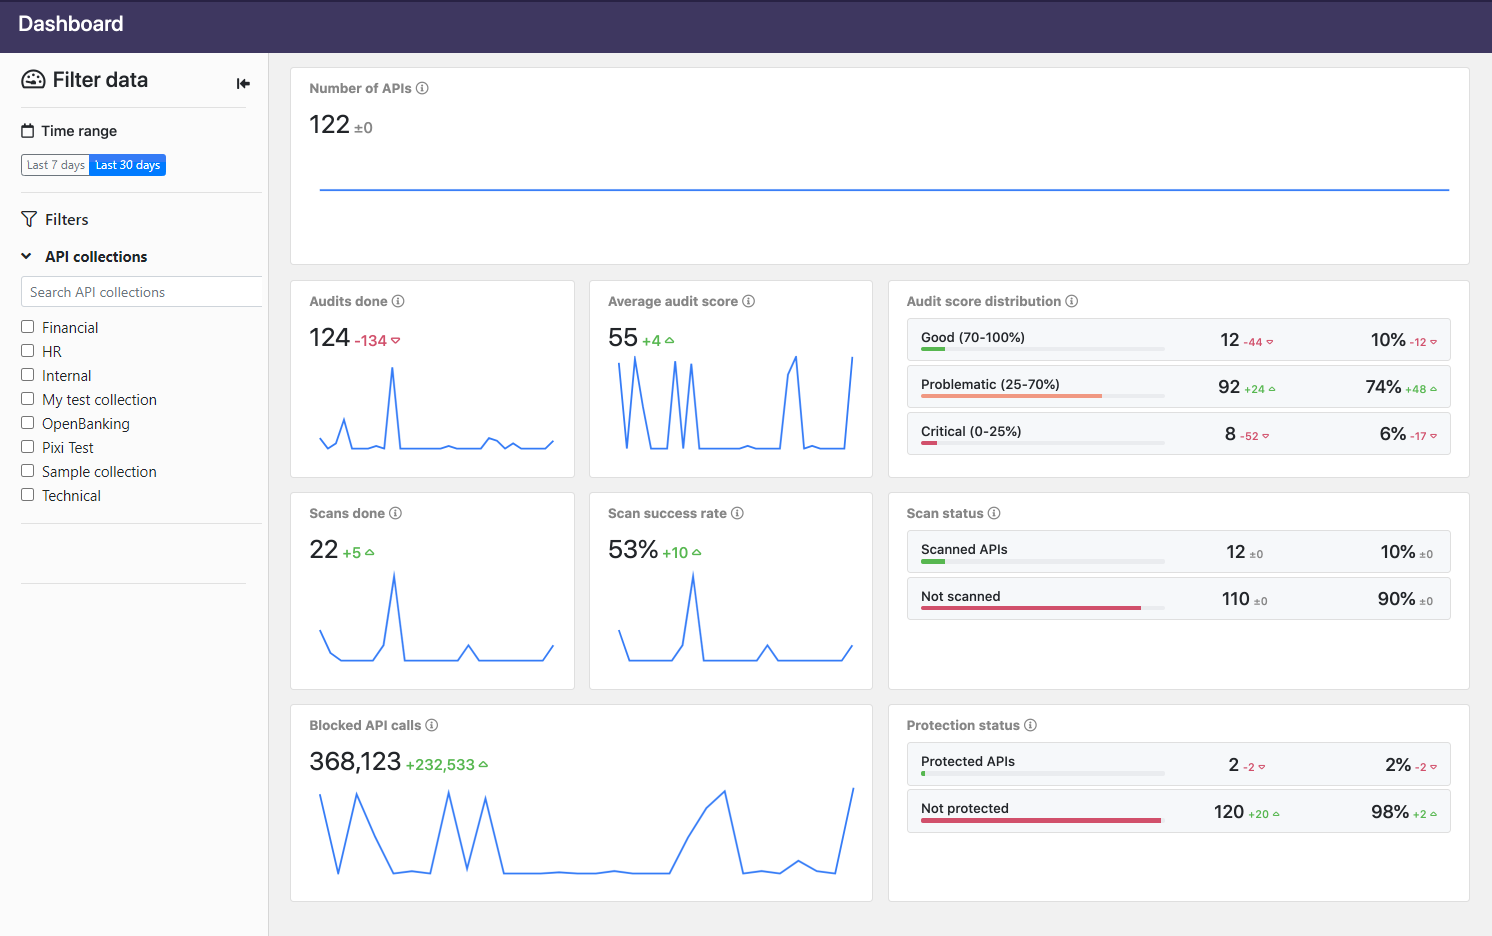
View statistics for API collections
You can get statistics on the quality and security of your APIs in a particular API collection from the dashboard charts based on results from Security Audit and API Scan.
- Go to the API collection you want, and click Collection dashboard. You can see charts for all APIs in that API collection.
- Click the toggles to change the view in the charts. If you hover on the charts, you see additional information in tool tips.
View security dashboards
After you have deployed the protection for your API, you can monitor the API Firewall instances currently protecting your API as well as the API traffic to it in 42Crunch Platform.
- In 42Crunch Platform, click API Firewall instances. You can see all active API Firewall instances currently protecting your APIs.
- The instances that 42Crunch Platform can communicate with are marked green to indicate they are running normally.
- The instances that 42Crunch Platform cannot communicate with are marked red to indicate they are not available for the platform to check their status.
- Stopped API Firewall instances are not shown: when an API Firewall instance is stopped, its container exists and the instance is automatically removed from the list.
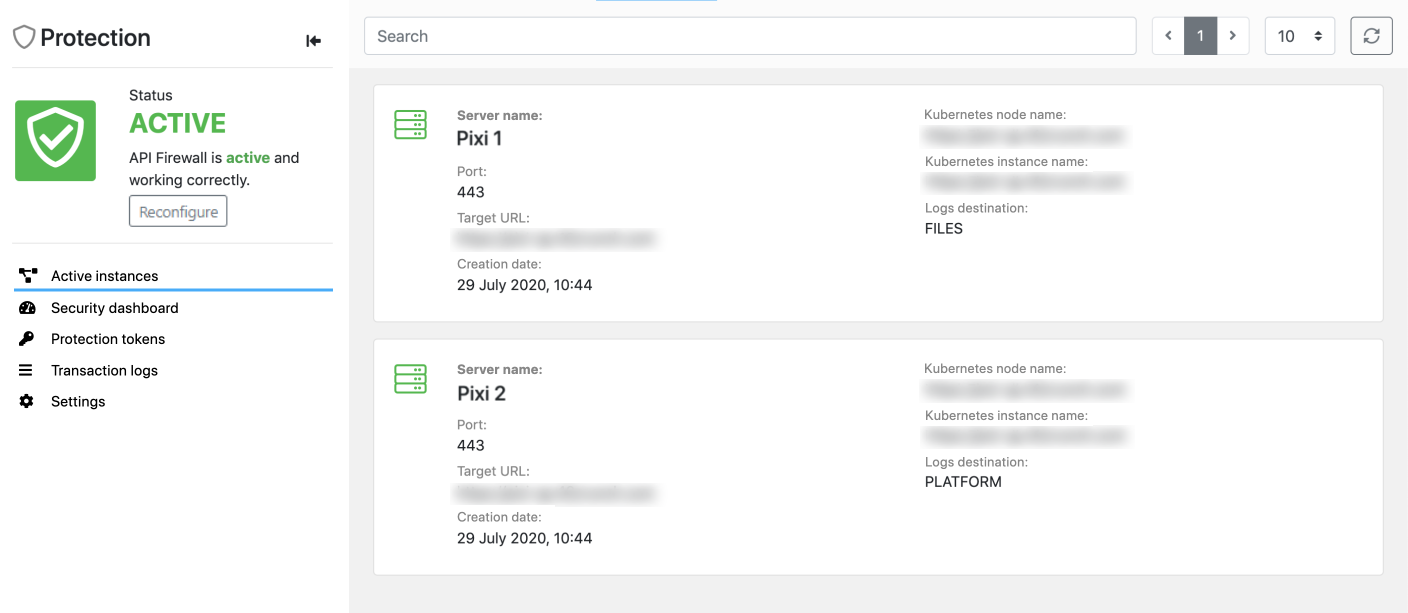
The development of this view is still ongoing and it is only available to organization administrators. Regular users can still view API Firewall instances protecting their APIs by going the API they want and clicking Protection > Active instances.
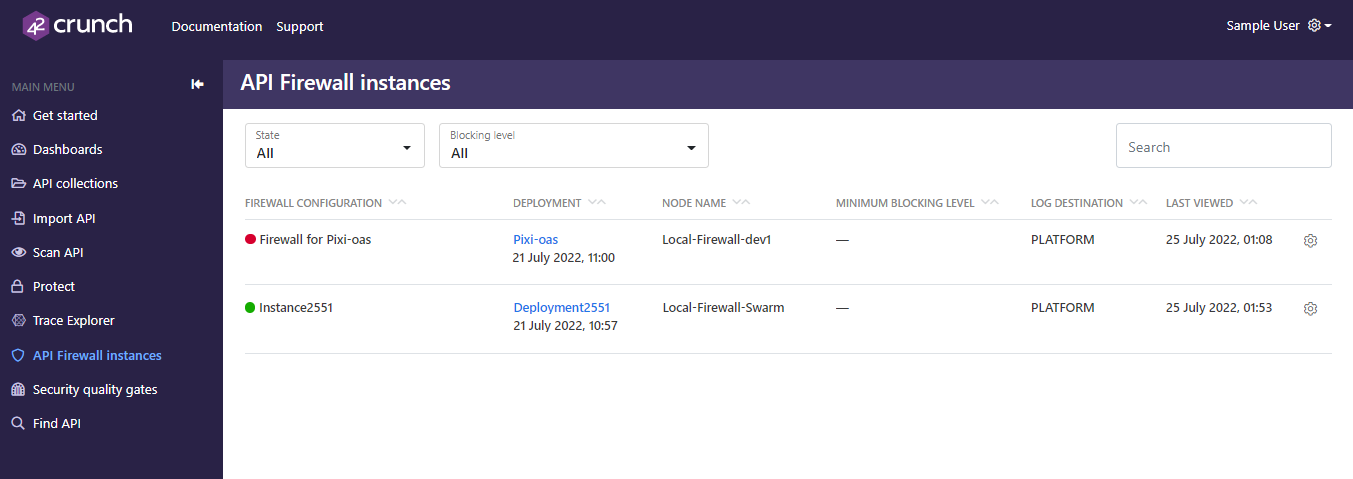
- To view the details of an instance, click the deployment name.
- For at-a-glance view of the main trends with the protected API, click Security dashboards.
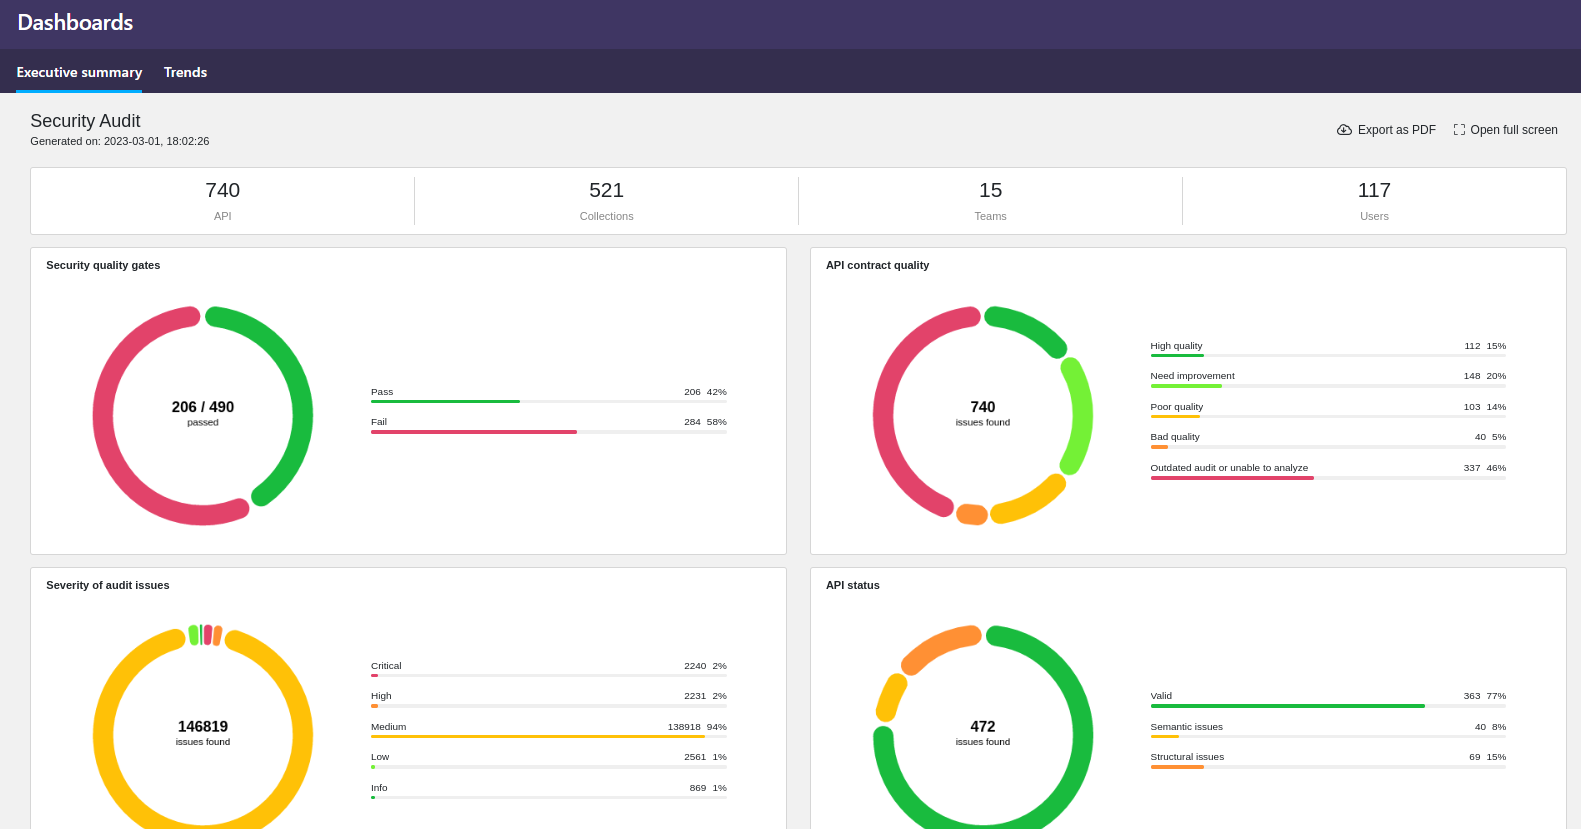
View executive dashboard
You can check the statistics on the executive dashboard in 42Crunch Platform to get an overall view of the quality and status of all APIs in your organization.
Executive dashboard is only available for organization administrators.
- In the main menu on the left, click Dashboards.
- On the Executive summary tab, you can see statistics on API quality, such as are APIs passing the quality criteria of your security quality gates.
You can also export the executive summary as a PDF for sharing, or view it full screen, for example, to present it to others in a meeting.
- On the Trends tab, you can see the trends in Security Audit, API Scan, and API Protection. Use the filters on the left to choose what data is shown in the charts. If you hover on the charts, you see additional information in tool tips.
View API transaction trace
You can use Trace Explorer to view the detailed trace of the blocked API transactions of any protected API you have access to.
Log destination PLATFORM (alone or with STDOUT) is not suitable for firewall instances running in production environment due to the volume of logs produced. We recommend setting the log destination to FILES or STDOUT (or both) in production or for performance testing.
Using the default size for the container file system is fine for testing, or when you can be sure that the logs volume stays low. However, the volume of logs can rapidly increase, especially in production, so if you want to use PLATFORM or FILES (alone or with STDOUT), you must plan for this growth to avoid running out of disk space in your API Firewall container. Either reserve enough disk space, or mount an external disk as a volume.
If you use only STDOUT, then all logs are pushed out of the container, and container disk space is not a concern.
Depending on the nature of your API, transaction logs could include personally identifiable information that falls under, for example, GDPR regulations. To facilitate the requirements from these regulations, such as the right to forget, it is possible to delete transaction logs from 42Crunch Platform. See Delete transaction logs.
- In 42Crunch Platform, click Trace Explorer.
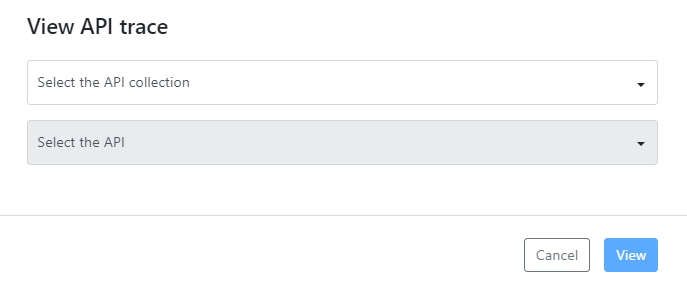
- Select the API collection you want.
- Select the API which trace to view, and click View. You can see the transaction logs of all the transactions that the API Firewall instance protecting the API have blocked.
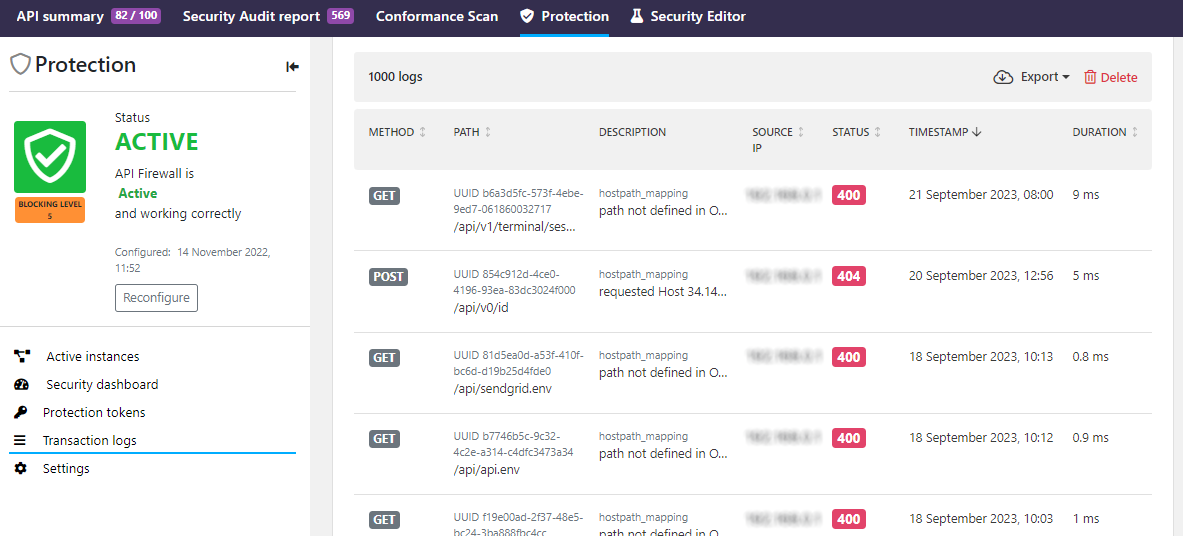
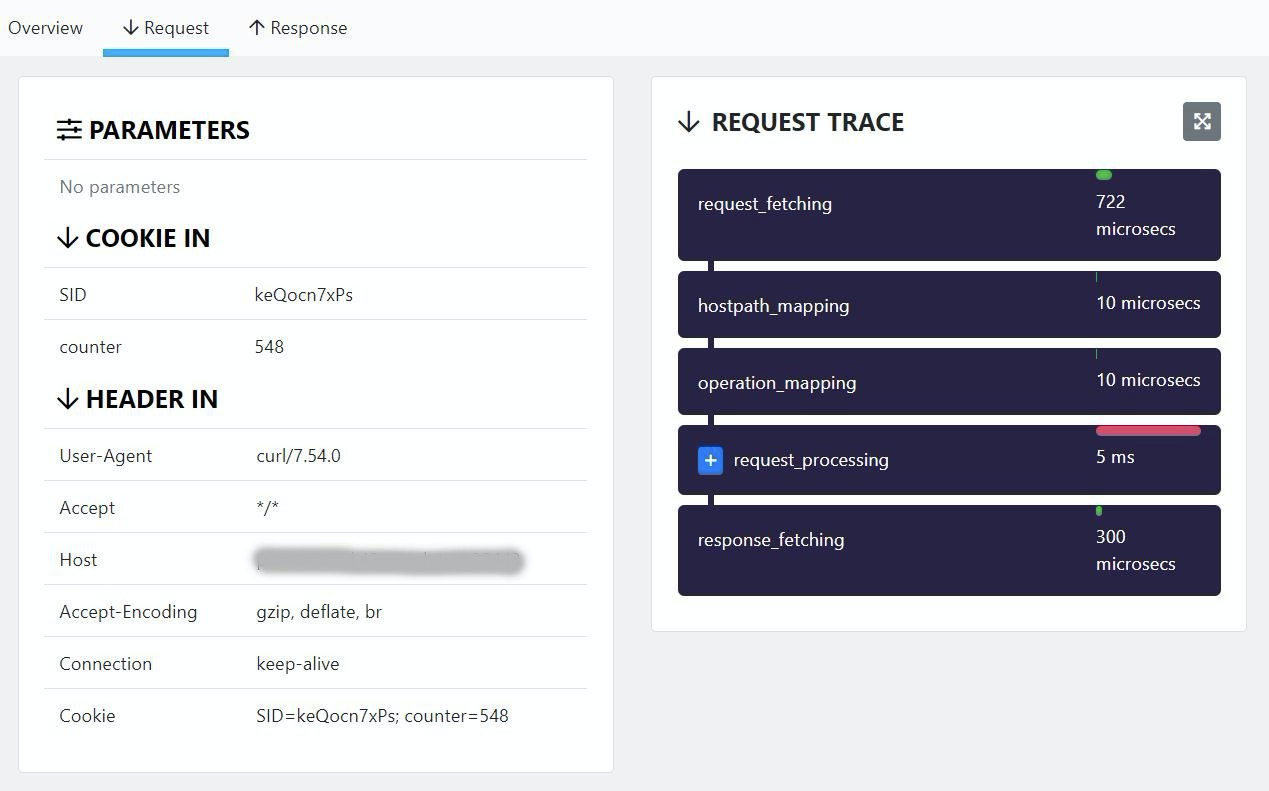
- To view more details on a blocked transaction, such as the hostname of the API Firewall instance that blocked it, click the transaction you want.
- To view the how the transaction was processed, click either Request or Response depending which path you want to view.
You can also get to the transaction logs from the Protection tab of the API.
By default, API Firewall publishes logs to 42Crunch Platform, so that you can monitor the real-time traffic in the dashboards and Trace Explorer. However, you can also switch the logs destination for an API Firewall deployment to a directory you mount to it. For more details, see Switch log destination for API Firewall logs.
Delete transaction logs
Depending on the nature of your API, transaction logs could include personally identifiable information that falls under, for example, GDPR regulations. To facilitate the requirements from these regulations, such as the right to forget, it is possible to delete transaction logs from 42Crunch Platform.
- In 42Crunch Platform, go to view the transaction logs from the API Firewall instance you want.
- Click Delete.
- Select the cut-off time for the logs to delete, and click Delete.
All transaction logs produced by that API Firewall instance that are older than the time you selected are permanently deleted from 42Crunch Platform. Transaction logs that are newer than the time you selected are retained and the firewall instance continues to write transaction logs as before.
Logs written to other destinations than 42Crunch Platform (files, STDOUT) are not affected and need to be separately deleted as necessary. Access and error logs that API Firewall also produces are not affected, only transaction logs.
What is...
How to...