Security Editor and extensions for third-party editors
API Security Audit tells what is the state of security in your APIs and what kind of issues are hiding in their API definitions. However, running Security Audit on your APIs does not in itself make them more secure, it just provides a road map for you. To increase the security of your APIs, you must fix the issues in the API definitions that Security Audit found.
The issues represent real concerns and security risks in your API definition, and they may either prevent API Protection completely, or severely impact its quality. We highly recommend that you fix all found issues.
You can edit API definitions either directly in 42Crunch Platform with Security Editor, or outside the platform in an external editor. If you use Microsoft Visual Studio Code (VS Code), JetBrains IDEs, or Eclipse IDE, or Microsoft Visual Studio (VS), you can install our extension to your editor and run Security Audit on the API definition you are working on right in your editor. For more details on the integration, see IDE integration.
You can also integrate Security Audit with your CI/CD pipeline so that any changes to APIs in your project are automatically audited for security. For more details, see CI/CD integration.
Security Editor
The Security Editor tab enables you to fix the issues that Security Audit found directly in 42Crunch Platform. You can see the issues Security Audit found in your API and your API definition side by side, so comparing them is easy. If you click on an issue, Security Editor shows where in the API definition the issue is located and you can view its details:
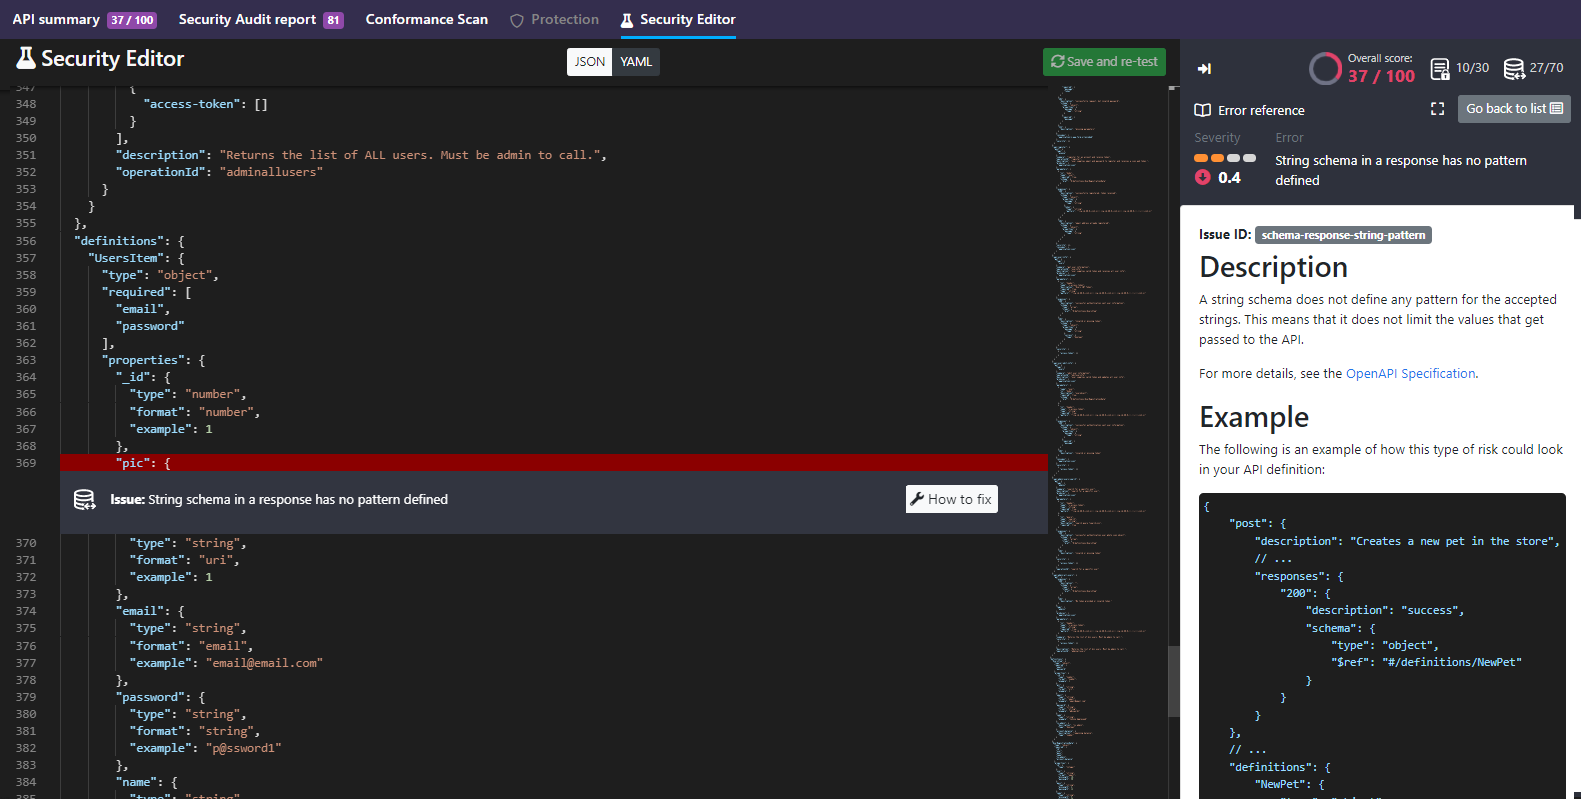
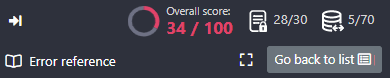
The small scoreboard at the top of the list shows how well your API scored overall and how the score is split between security and data definition quality.
By default, Security Editor shows all found issues in the list, but you can filter the shown issues based on the severity level.
For OpenAPI definitions, the editor shows you the API definition in the format (JSON or YAML) it was imported to the platform. However, you can switch between the formats in the editor as needed.
If you switch the format in the editor and save the API definition, it is converted to the new format. For more details, see Convert APIs.
Visual Studio Code extension
The OpenAPI (Swagger) Editor for VS Code makes creating and navigating API definitions quicker and easier, and integrates Security Audit with VS Code.
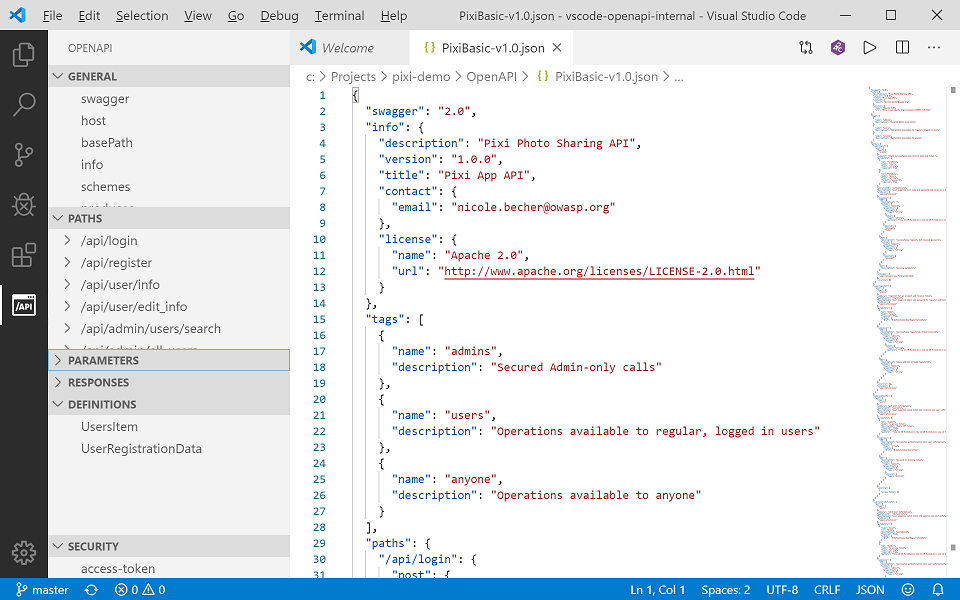
With the IDE extension, you can run Security Audit straight from the VS Code window: just click the button at the top edge. You need a token to authenticate to Security Audit. You can use the OpenAPI (Swagger) Editor extension to audit both OpenAPI definitions and GraphQL definitions.
You can also find a tutorial video on OpenAPI (Swagger) Editor in VS Code here.
Audit report in VS Code
Like in 42Crunch Platform, running Security Audit from VS Code gives an audit score for the API definition and produces a report on the found issues. However, navigating a report is bit different from the platform UI.
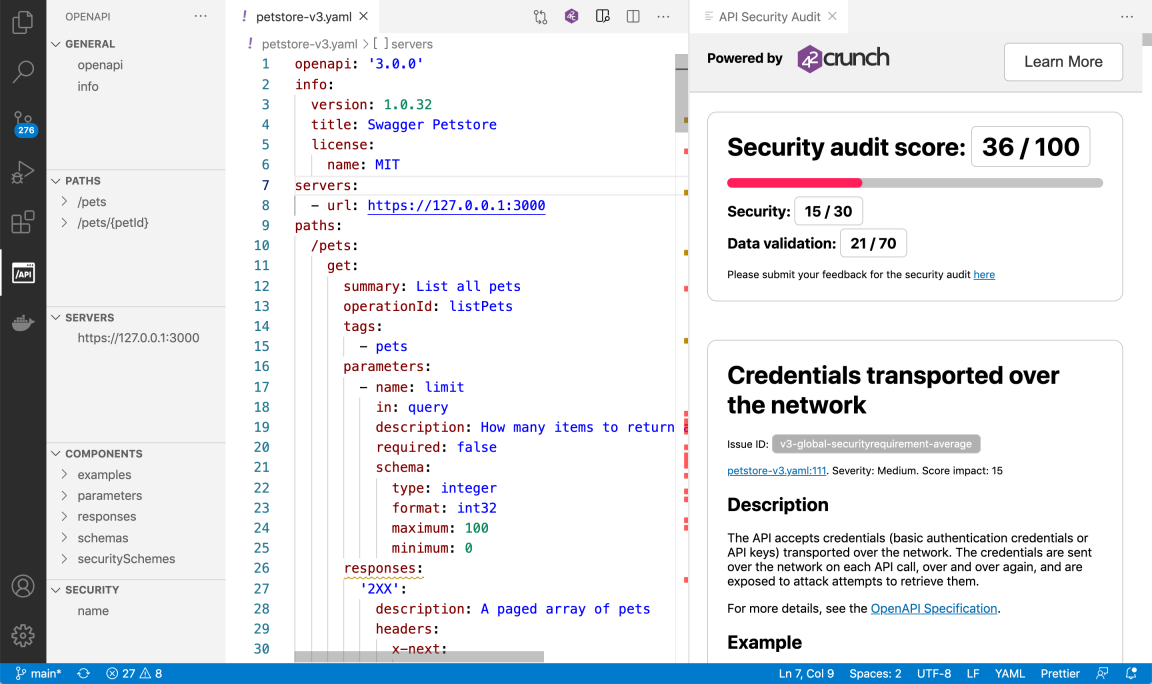
The scoring, issue IDs, and the descriptions and remediations for all found issues are shown on the right. The status bar at the bottom left shows a quick overview on the severity levels of the found issues:
- : critical or high
- : medium
- : low
You can click on the icons to open the problems view that shows the titles of critical, high, and medium issues.
The color blocks in the minimap show where in your API definition the issues occur, so you can easily hop to check the spot in your code. In the code, wavy lines in matching color mark the affected element and hovering on it shows all issues in that spot.
You can also open an audit report exported from 42Crunch Platform and view it in your IDE. See Load audit report from a file.
JetBrains extension
The OpenAPI (Swagger) Editor for JetBrains IDEs makes creating and navigating API definitions quicker and easier, and integrates Security Audit with JetBrains IDEs.
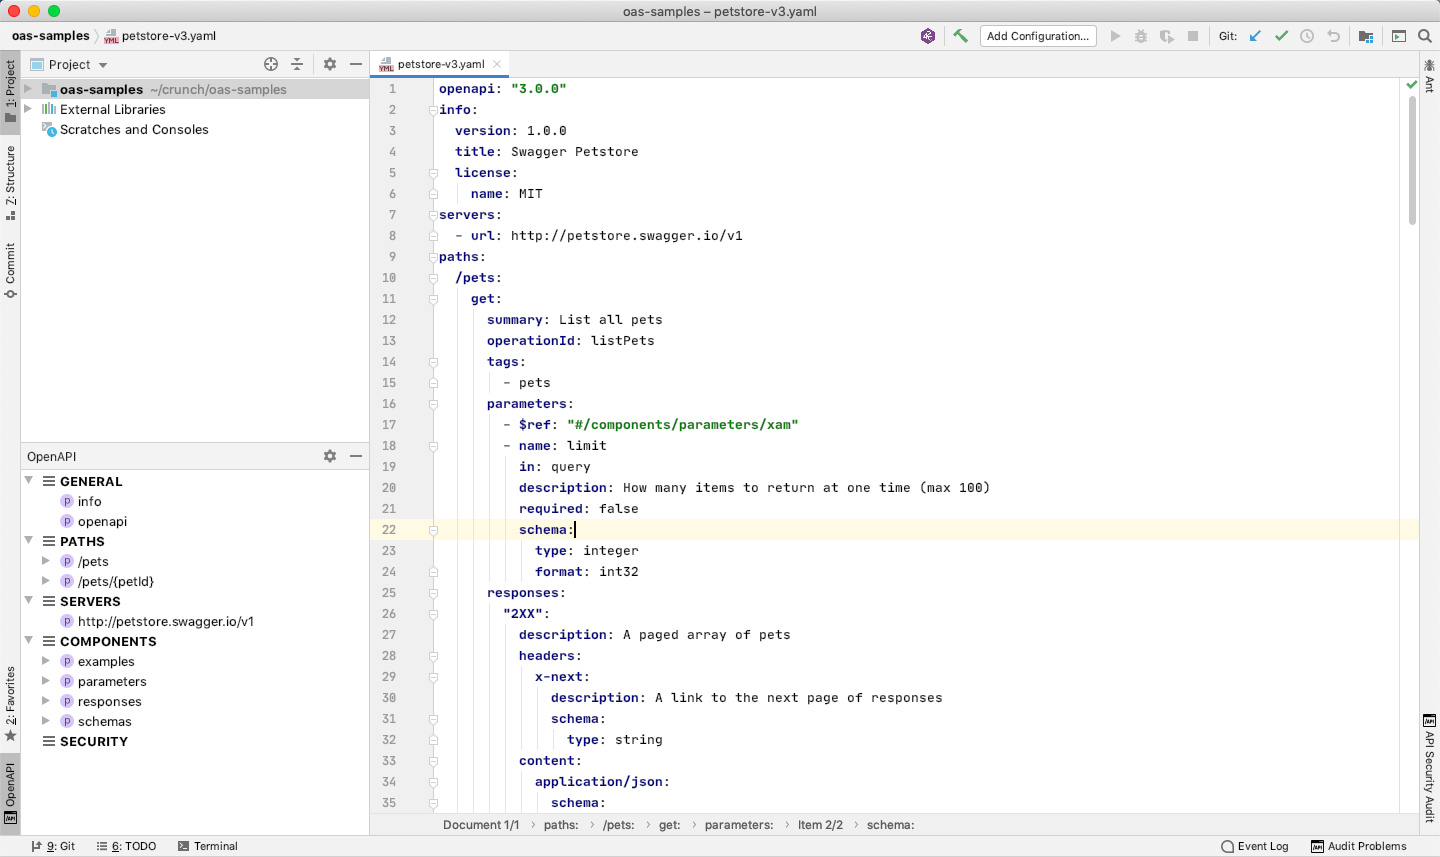
With the IDE extension, you can run Security Audit straight from the IDE: just click the button at the top edge. You need a token to authenticate to Security Audit. You can use the OpenAPI (Swagger) Editor extension to audit both OpenAPI definitions and GraphQL definitions.
Audit report in JetBrains IDEs
Like in 42Crunch Platform, running Security Audit from your IDE gives an audit score for the API definition and produces a report on the found issues. However, navigating a report is bit different from the platform UI.
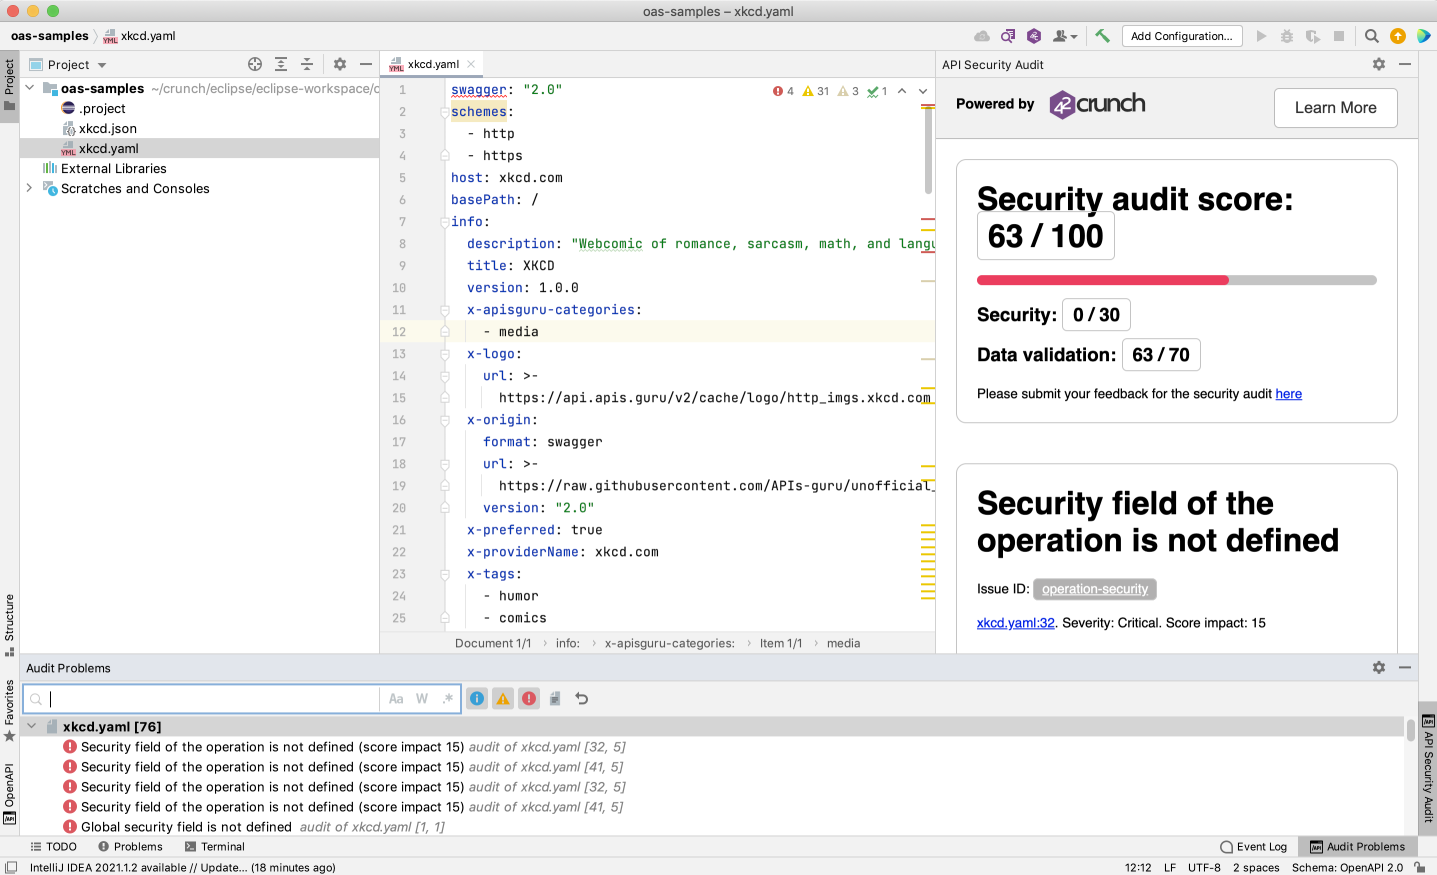
The scoring, issue IDs, and the descriptions and remediations for all found issues are shown on the right.
You can click on the icons to open the problems view that shows the titles of critical, high, and medium issues:
- : critical or high
- : medium
- : low
The color blocks in the minimap show where in your API definition the issues occur, so you can easily hop to check the spot in your code. In the code, wavy lines in matching color mark the affected element and hovering on it shows all issues in that spot.
You can also open an audit report exported from 42Crunch Platform and view it in your IDE. See Load audit report from a file.
Eclipse extension
The OpenAPI (Swagger) Editor for Eclipse IDE makes creating and navigating API definitions quicker and easier, and integrates Security Audit with Eclipse.
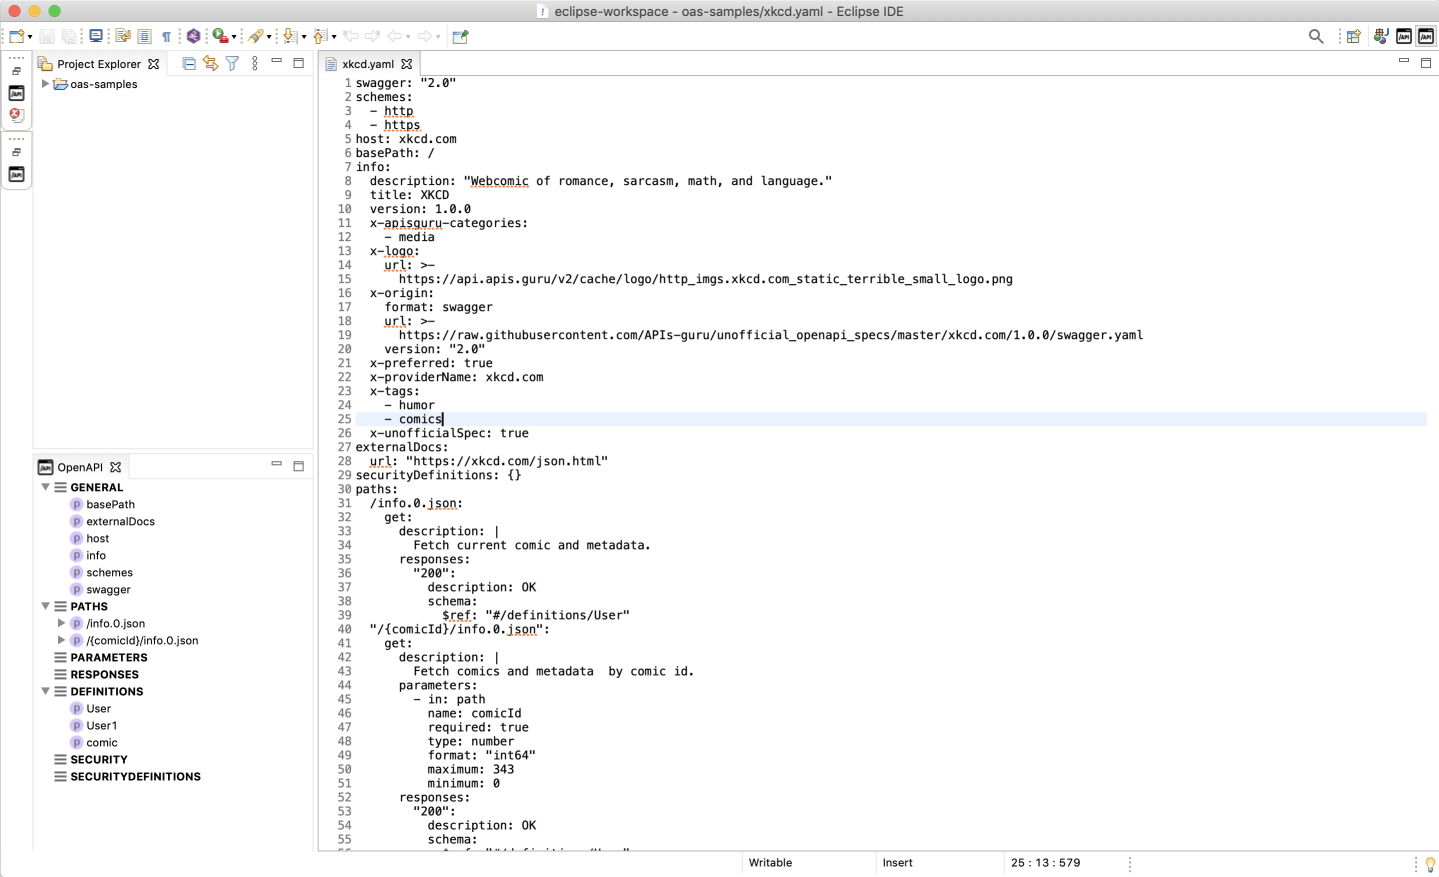
With the IDE extension, you can run Security Audit straight from the Eclipse window: just click the button at the top edge of the workbench. You need a token to authenticate to Security Audit. You can use the OpenAPI (Swagger) Editor extension to audit both OpenAPI definitions and GraphQL definitions.
Audit report in Eclipse
Like in 42Crunch Platform, running Security Audit from Eclipse gives an audit score for the API definition and produces a report on the found issues. However, navigating a report is bit different from the platform UI.
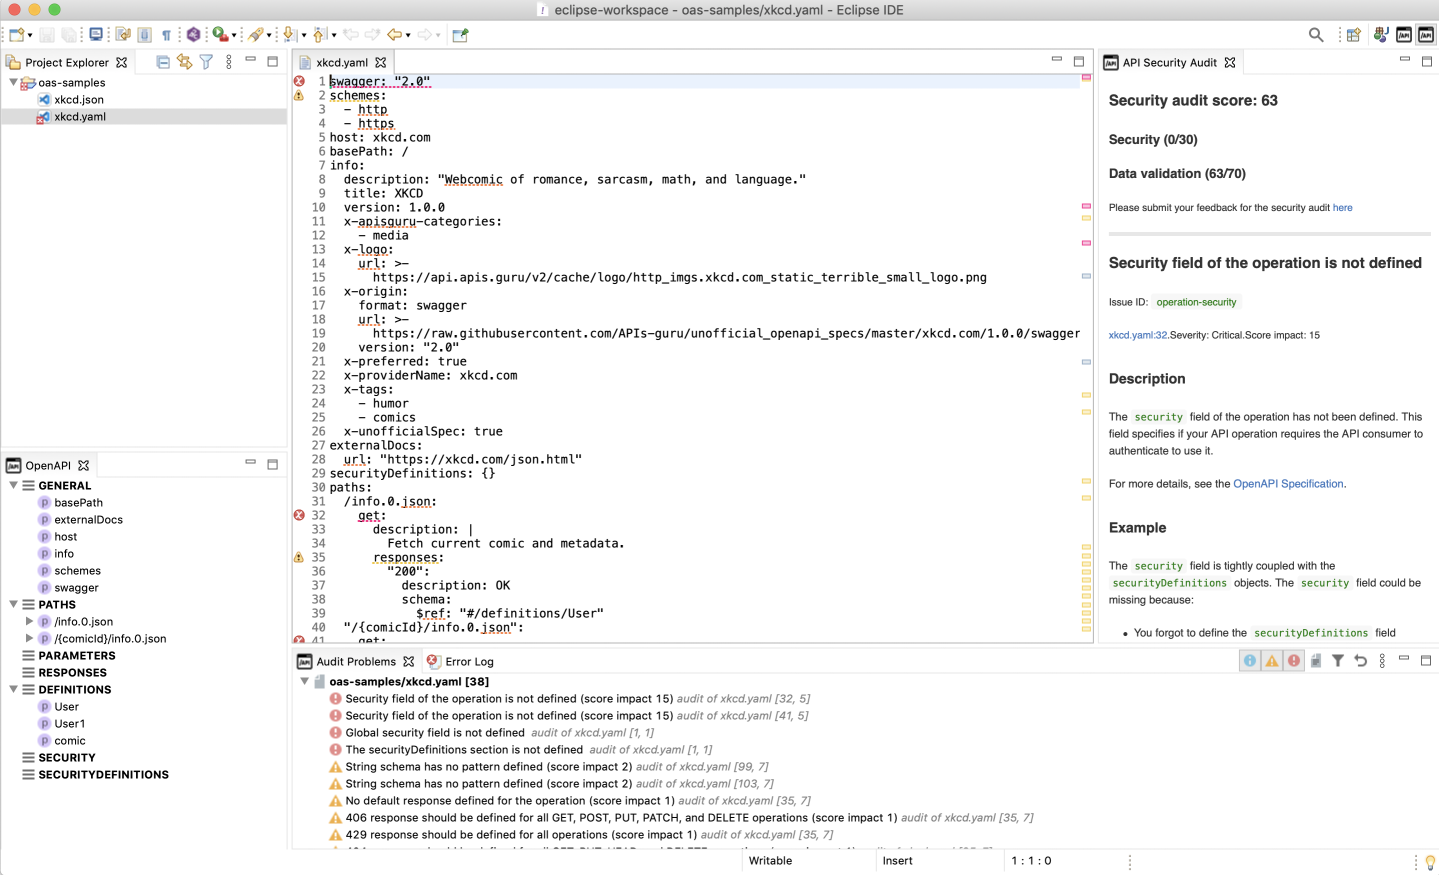
The scoring, issue IDs, and the descriptions and remediations for all found issues are shown on the right.
You can click on the icons to open the problems view that shows the titles of critical, high, and medium issues:
- : critical or high
- : medium
- : low
The color blocks in the minimap in the editor show where in your API definition the issues occur, so you can easily hop to check the spot in your code. In the code, dashed lines in matching color mark the affected element and hovering on it shows all issues in that spot.
You can also open an audit report exported from 42Crunch Platform and view it in your IDE. See Load audit report from a file.
Visual Studio extension
The OpenAPI (Swagger) Editor for VS makes creating and navigating API definitions quicker and easier, and integrates Security Audit with VS.
(missing or bad snippet)