Integrate Security Audit with Azure Pipelines
You can integrate API Security Audit in Microsoft Azure Pipelines through a custom build task in the extension REST API Static Security Testing.
You must have an account in 42Crunch Platform that the build task in Azure Pipelines can use to access Security Audit. Currently, GraphQL APIs are not supported.
For more details on Azure Pipelines, see Azure Pipelines documentation.
Security Audit is integrated through a plugin that adds a build task or job to your CI/CD pipeline. The plugin checks the quality of the OpenAPI files present in your project. If the detected APIs do not meet the criteria you define in the plugins or in your security quality gates in 42Crunch Platform, the plugin fails and aborts the build, so that bad APIs are not included in your project.
The process has two phases:
- Discovery: The task in your CI/CD pipeline checks your project for any
.json,.yaml, and.ymlfiles. When it finds a file, it checks if the file states that it is an OpenAPI file. If the file is.yamlor.yml, it is automatically converted to JSON. The discovered APIs are automatically uploaded to an API collection in 42Crunch Platform. - Audit: Security Audit audits the uploaded APIs for their well-formedness and security. If the quality of the APIs meets your criteria, the task or job ends with a success, if they do not, the task fails. Your CI/CD pipeline processes the result as you have defined and the continues to the next task or job.
The plugin uses API tokens with specific access rights (scopes) to access 42Crunch Platform.
When the integration plugin runs, it uploads the API definitions it finds during the discovery phase to a particular API collection in your organization in 42Crunch Platform. By default when running on branch, the plugin uses the naming convention <shortened-source-control-uri> Branch:<branch-name> for the created API collection, for example, 42Crunch/sample Branch:sample.
On subsequent runs, the plugin synchronizes the contents of the API collection with the APIs in your source control repository:
- APIs added to your repository are added to the collection.
- APIs removed from your repository are removed from the collection
- APIs found both in your repository and in the collection retain their API UUIDs in 42Crunch Platform but their contents are replaced with the contents of the files in your repository
Make sure that you do not accidentally overwrite things in the API definition that you would like to keep. The plugin will replace all contents in the APIs in 42Crunch Platform with the contents of the API files in your repository. Any changes that are not reflected in the OpenAPI file in your repository are lost from the platform.
Create an API token for the build task
You must add an API token that the build task uses to authenticate to Security Audit.
- Log in to 42Crunch Platform, and click next to your username.
- Select Tokens, and click Create new token.
- Enter a unique and descriptive name for the token, such as
Security Audit token. - Make sure the token type is API token, and in token access rights, select API Security Audit, List resources, and Delete resources.
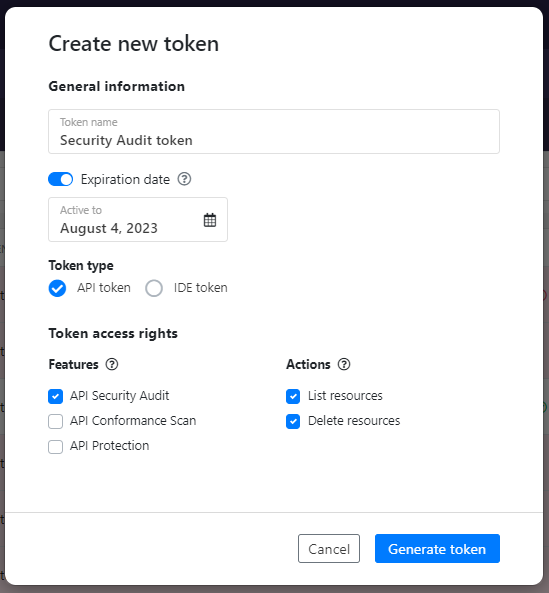
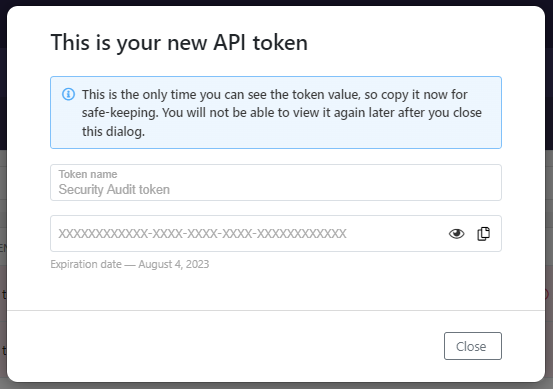
- Click Generate token.
- Copy the token value, you will need it when you configure REST API Static Security Testing.
Add a service connection from Azure to 42Crunch Platform
Before you add the build task to your Azure pipeline, you must add a service connection to 42Crunch Platform to your Azure project so that your pipeline can retrieve the API token you created for authentication.
- Log in to your Azure DevOps account.
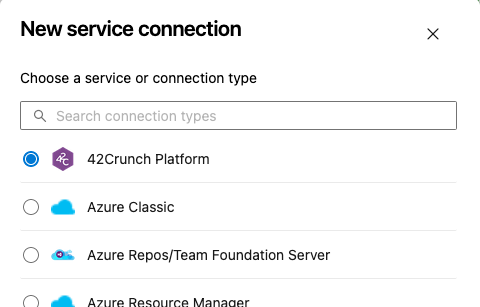
- In your Azure project, go to Project settings > Service connections, and add a new service connection.
- Select 42Crunch Platform as the type of service connection, then select Next.
- Enter the platform URL that you use to access 42Crunch Platform. For users in most organizations that is
https://us.42crunch.cloud. However, enterprise customers can get a dedicated platform instance, with its own custom platform URL. You can check you what your platform URL is on the environment tab of your organization in 42Crunch Platform.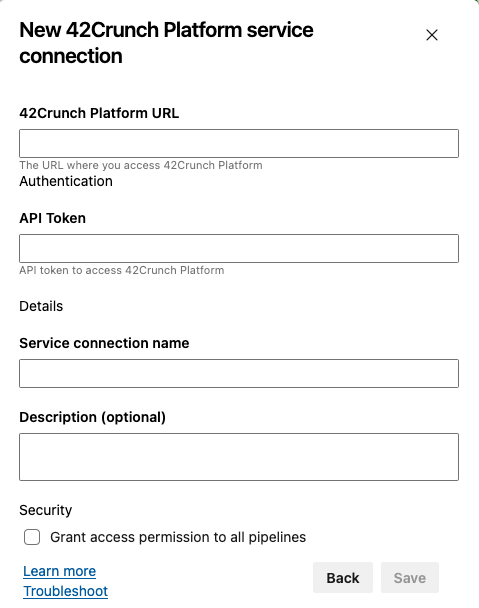
- Enter the value of the API token that you created for the build task.
- Give the connection a name and add a description if you want.
- If you have more than one pipeline, you can allow all pipelines to use the same token to authenticate to 42Crunch Platform, or you can choose to create individual tokens and connections for your pipelines.
- When ready click Save.
The service connection is added to your Azure project and you can use it when configuring the build task.
Add the build task to your Azure pipeline
To run the build task, you must add it to your Azure pipeline.
- If your organization in Azure DevOps does not yet have the extension REST API Static Security Testing installed, install it from Visual Studio Marketplace. This needs to be done only once for each organization: once the task is installed, it is available for the whole organization.
- Go to the pipeline where you want to add the build task, and click Edit. The file
azure-pipelines.ymlopens. - Click the cursor under
stepswhere you want to add the build task, and then find and click on the task called 42Crunch API Security Audit. - Select the service connection you created for connecting to 42Crunch Platform.
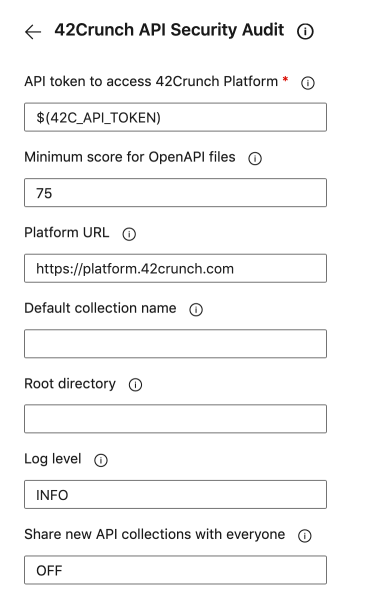
- Enter the minimum API score that the audited OpenAPI definitions must get from the audit for the build task to succeed. If any API definitions scores lower than the minimum score you set, the build task fails. The default is
75.The fail-on criteria you set in the CI/CD plugin, such as the minimum score, are independent from the acceptance criteria defined in security quality gates (SQGs). This means that your CI/CD build can fail either because the criteria of the plugin are not met, the criteria of a SQG are not met, or both.
- Select if you want to automatically share any new API collections that the build task creates with other users in your organization (off by default). You can also change the sharing of the API collections later in 42Crunch Platform.
- Set the level of detail (
FATAL,ERROR,WARN,INFO,DEBUG) for the logs that the task produces. - Click Add. The build task is added to your pipeline and you can see its definition under
stepsinazure-pipelines.yml. - Click Save to save your changes to the pipeline. To test the build task, run your Azure pipeline.
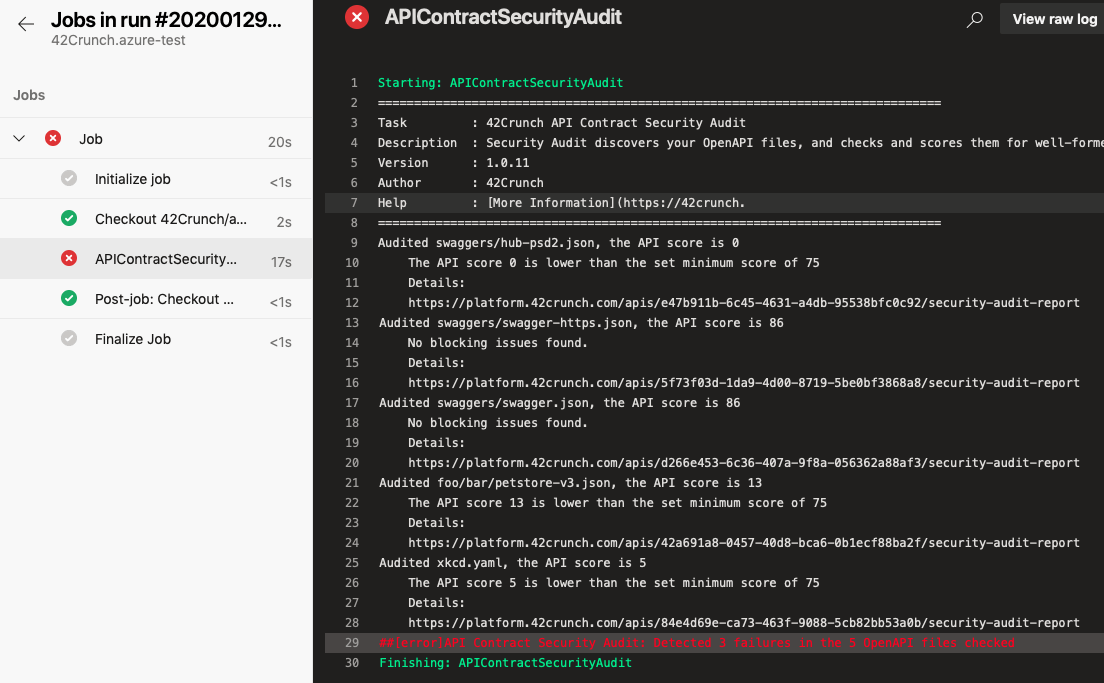
The build task will either succeed or fail depending on the minimum score. The plugin also automatically checks the status of all SQGs applied to the APIs it found in the repository. If any of the SQGs fails, the build automatically fails too. The summary of the run in the pipeline jobs provides you further details on how the job went.
The task uploads all discovered OpenAPI definitions to an API collection in 42Crunch Platform. By default when running on branch, the plugin uses the naming convention <shortened-source-control-uri> Branch:<branch-name> for the created API collection, for example, 42Crunch/sample Branch:sample.
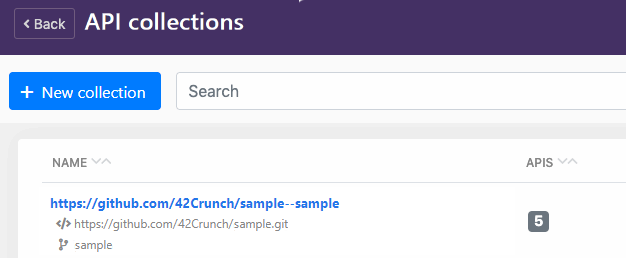
The build task uses the build variables Build.Repository.Uri and Build.SourceBranch to get the details directly from your source control.
The API definitions in the collection show the filepaths they have in the repository:
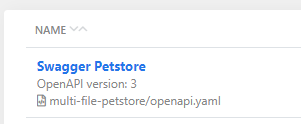
The logs of the run include the URL of each discovered API in the platform. You can copy the URL and paste it to your browser to view the detailed audit report of the corresponding API.
Write summary of the plugin run in a file
If you want, you can set the plugin to write and store a report on the plugin run as a JSON file, so that it is easy, for example, to see and communicate the API UUIDs of the uploaded APIs.
This is not the audit report that provides details on the issues that Security Audit found in your APIs and how to remediate them, but a separate, optional summary providing some basic details on the APIs that the plugin processed. The full audit reports are not included in this summary, but are available in 42Crunch Platform.
- Go to the CI/CD pipeline you want and open the settings of the integration plugin for editing.
- In Write json report to, enter the filename or path that you want to use for report file.
The report is in JSON format, so ensure that you either specify
.jsonas the file extension (as intest/myReport.json) or omit the extension completely (test/myReport).- If you specify only the filename, the plugin creates the file in the root directory that it is pointed to start from.
- If you specify a path, the path must be under the root directory and all specified directories must exist. The plugin only generates the JSON file, not directories.
The plugin does not delete or overwrite any summaries from previous runs, so if a file with the same name exists, you see an error. To avoid this, you can create a separate workspace for each pipeline pass, add a task to clear the workspace before starting, or include a variable to the filename (such as the build number or timestamp) to ensure that each filename is unique.
- Save your changes.
Next time you run the pipeline, the integration writes a summary report as a JSON file in the location you specified. This report shows the details on discovered, such as:
- Filename
- API UUID assigned for the API when it was uploaded to 42Crunch Platform
- Audit score
- Did the pipeline task fail and if yes, why
- Any errors that occurred when processing the API
Fine-tune the plugin configuration
You can further fine-tune how the integration works by adding a configuration file called 42c-conf.yaml to the root directory of your source code repository where the CI/CD pipeline connects to. You can, for example:
- Configure the plugin to run in the collection mode, applying predefined settings and sharing with teams in your organization on any API collections that it creates.
- Control what happens in the discovery phase.
- Map OpenAPI files in your repository to API UUIDs of APIs in the platform.
- Specify
fail_onconditions to define what the plugin reports as failures.The fail-on criteria you set in the CI/CD plugin, such as the minimum score, are independent from the acceptance criteria defined in security quality gates (SQGs). This means that your CI/CD build can fail either because the criteria of the plugin are not met, the criteria of a SQG are not met, or both.
You can specify different configurations for different branches, tags, or even pull requests. For more details, see the configuration examples in our Resources repository in GitHub.
Configurations for branches and tags is matched based on the name of the branch or tag. Configurations for pull requests is matched based on the target branch.
Change the default collection name
By default when running on branch, the plugin uses the naming convention <shortened-source-control-uri> Branch:<branch-name> for the created API collection, for example, 42Crunch/sample Branch:sample. However, you can specify a different syntax for the new collections that the plugin uses by default.
- Go to the pipeline you want and open the settings of the integration plugin for editing.
- In Default collection name, enter the syntax for the default collection name you want to use. You can use text (like
foo), reference to variables (${repository}), or a combination of the two (foo ${repository}). You can use the following variables that are populated from your repository details:repository: The full repository URL.repo_short_path: A shortened path of the repository URL (the leading/and the trailing.gitare omitted).repo_hostname: The hostname from the repository URL.branch_info:The syntaxBranch:<branch name>, or an empty string if this information is not available.tag_info: The syntaxTag:<tag name>, or an empty string if this information is not available.pr_info: The syntaxPR:<pr id>, or an empty string if this information is not available.
- When ready, save your changes.
Next time you run the pipeline, the integration plugin uses the syntax you defined and creates new API collections in 42Crunch Platform (if collections with the same names do not yet exist) where it loads the discovered APIs.
You can also define collection names for specific branches, tags, and pull requests using the property collection_name in the configuration file 42c-conf.yaml.
Next time you run the pipeline, the integration plugin will start the discovery phase from the directory path you defined and check that directory and any subdirectories under it for OpenAPI files.
Set the root directory for the plugin
By default, the integration plugin uses the root directory of your repository as its starting point. However, you can also set a specific directory that the plugin will use as its root.
If you have configured 42c-conf.yaml for your plugin, make sure it is located in the root directory that you want the plugin to use. Otherwise, the configuration file is ignored.
- Go to the CI/CD pipeline you want and open the settings of the integration plugin for editing.
- In Root directory, enter the path of the directory you want to use as the root directory.
- Save your changes.
Next time you run the pipeline, the integration plugin will start the discovery phase from the directory path you defined and check that directory and any subdirectories under it for OpenAPI files.
Add tags to APIs
You do not have to wait till your OpenAPI definitions are in 42Crunch Platform to apply tags to them. If you have some tags that you know your APIs need, you can set those tags directly in the CI/CD plugin. The plugin then applies the tags to all new APIs it discovers. For more details, see Tags.
Tags consist of category:tag value pairs, and each tag always has a category it belongs to. Before you start, the categories you want to use must already exist in 42Crunch Platform.
If a tag category allows users to create tags in it, you do not necessarily have to go and create the tags beforehand — in this case, the CI/CD plugin can create any missing tags for you. However, if a tag category does not allow user-created tags, all tags you want to apply must exist before you run your pipeline, otherwise the build task fails. For more details, see Category settings.
- Go to the CI/CD pipeline you want and open the settings of the integration plugin for editing.
- In Set API tags, list the tags that you want the plugin to apply to APIs it discovers. If applying multiple tags, separate each key-value pair with a space. For example, if you would want to apply a tag called
foofromcategory1and a tag calledbarfromcategory2, you would entercategory1:foo category2:bar.Category settings may restrict how you can use the tags from a category, such as how many tags from it you can apply to a single API. The CI/CD plugin cannot apply tags from a category that only allows organization administrators to apply tags.
- Save your changes.
Next time you run the pipeline, the integration plugin will apply the tags you listed to all new APIs that it discovers in your repository before the APIs are audited. Only newly discovered APIs are tagged: the plugin does not apply tags to APIs it has already uploaded to 42Crunch Platform, nor to any APIs you might have mapped in your 42c-conf.yaml file.
If the CI/CD plugin cannot apply one or more of the tags you have listed, either because the category does not exist or the category settings prevent the plugin from applying using it or creating any missing tags, the plugin fails the build task. If this happens, you can:
- Remove the tags that cause the failure from the plugin configuration.
- Ask you organization administrators to change the settings of the tag categories that are causing the problem.
- Ask your organization administrators to create any missing tags that you need.
Tags created through the CI/CD plugin do not have descriptions, but organization administrators can update the tags to add one.
Generate a SARIF report
You can set the CI/CD plugin to generate a SARIF (Static Analysis Results Interchange Format) report as part of its run.
- Go to the CI/CD pipeline you want and open the settings of the integration plugin for editing.
- In Name of SARIF report, enter
results.sarif, and save your changes.
Next time you run the pipeline, the CI/CD plugin will generate the SARIF report in the root directory that it is pointed to start from (by default $(System.DefaultWorkingDirectory)). Depending on how you want to process or consume the SARIF report in downstream services, some additional configuration is needed. For example:
- To view the SARIF report on the UI, you can install and configure the extension SARIF SAST Scans Tab.
- To process the SARIF report in downstream services, you can add the build task Publish Pipeline Artifact after the audit task.
The additional services may pose requirements to the filename that the CI/CD plugin uses.
When configuring the additional tasks, if you have changed the root for the CI/CD plugin, you must provide the full path to the SARIF report in that directory, because the other tasks know nothing about the CI/CD plugin configuration. For example, if you have set the root directory of the CI/CD plugin to a directory called foo located directly under the root of your repository, the path you must use to fetch the SARIF report would be $(System.DefaultWorkingDirectory)/foo/results.sarif.
Use SQG criteria instead of plugin configuration
By default, the integration plugin configuration defines when the CI/CD task passes or fails, and there are some default values that the plugin uses if nothing else is specified. However, if you are using security quality gates (SQGs) in 42Crunch Platform for quality control, you might prefer SQGs to determine when the CI/CD task passes or fails. In this case, you can set the plugin to skip the locally defined fail-on conditions (such as minimum score, format validity, or forbidden issues) and only use those defined in the SQGs.
- Go to the CI/CD pipeline you want and open the settings of the integration plugin for editing.
- In Skip local checks, type
true, and save your changes.
Next time you run the pipeline, the plugin will only check the status of all SQGs applied to the APIs it found in the repository when deciding if the build passes or fails, and ignore any fail-on conditions defined in the plugin itself, including the default plugin configuration.
Stop the plugin from failing a pipeline
Sometimes you might want the CI/CD plugin just to report the found issues, not block the pipeline from continuing. For example, your repository might have plenty of APIs in early stages of their lifecycle, or you have just introduced the CI/CD plugin to the pipeline and need time to adjust to the set quality criteria. In this case, you can temporarily switch off all fail-on conditions that the CI/CD plugin would impose on a CI/CD job. The plugin keeps reporting on the discovered APIs but does not block the pipeline from proceeding to subsequent stages.
Switching off the fail-on conditions in the CI/CD plugin means that the plugin will cease to work as a quality control as it will never prevent potential problems in your APIs. We recommend that you use this option only after a careful consideration and only for a limited time. Remember to remove this setting from the plugin as soon as possible.
- Go to the CI/CD pipeline you want and open the settings of the integration plugin for editing.
- In Ignore failures, type in
true, and save your changes.
Next time you run the pipeline, the integration plugin runs normally, uploading each discovered API definition and its audit report to 42Crunch Platform, but does not fail the CI/CD job because of the audit results or SQG status. However, the plugin still produces logs as per usual, so you can check them to see the status of the discovered APIs.
Ignore network errors
If you are worried that issues in connectivity — such as in the rare case of the CI/CD plugin not being able to communicate to 42Crunch Platform — could unduly hinder an important CI/CD pipeline by causing it to fail, you can set the plugin to ignore connectivity issues.
Setting the CI/CD plugin to ignore network errors lessens the plugin's effectivity as a quality control, because the task does not stop the CI/CD pipeline even though it could not complete successfully due to a connectivity issue. This means that APIs that have quality or security issues in their OpenAPI definitions could slip through upon a successful CI/CD job. We recommend that you use this option only after a careful consideration.
- Go to the CI/CD pipeline you want and open the settings of the integration plugin for editing.
- In Ignore network errors, type in
true, and save your changes.
Next time you run the pipeline, if the integration plugin encounters a connectivity issue, it does not fail the CI/CD job and the pipeline proceed to subsequent steps. Errors that cannot be definitively deemed to be connectivity issues will still cause the plugin to fail the job. You can check the logs that the plugin produces to see if any errors occurred.
What is...
How to...
Integrate CI/CD solutions with 42Crunch Platform
Integrate Security Audit with Bamboo
Integrate Security Audit with Bitbucket Pipelines
Integrate Security Audit with CI/CD using a Docker image
Integrate Security Audit with GitHub Actions